by Calculated Risk on 9/28/2009 11:18:00 AM
Monday, September 28, 2009
Credit Indicators
I haven't posted this in some time. During the crisis these indicators showed the stress in the credit markets - now the LIBOR and TED spread just show that the Fed has been effective in lowering these rates. These might be interesting to watch as the Fed unwinds their various policy initiatives.
From Dow Jones: Key US Dollar Libor Downward Trend Stabilizes Monday
The cost of borrowing longer-term U.S. dollars in the London interbank market stabilized Monday, while the equivalent euro and sterling rates fell to record lows.That is good news for anyone with an ARM tied to the LIBOR.
Data from the BBA showed three-month dollar Libor ... remained unchanged from Friday at 0.2825%.
The three-month rate has fallen steeply since reaching 4.81875% on Oct. 10 2008, when interbank market tensions peaked.
 Click on graph for larger image in new window.
There has been improvement in the A2P2 spread. This has declined to 0.13. This is far below the record (for this cycle) of 5.86 after Thanksgiving, and is about the normal spread.
This is the spread between high and low quality 30 day nonfinancial commercial paper.
 The TED spread is now at the low end of the normal range of 19.22.
 This is the difference between the interbank rate for three month loans and the three month Treasury. The peak was 463 on Oct 10th and a normal spread is below 50 bps.
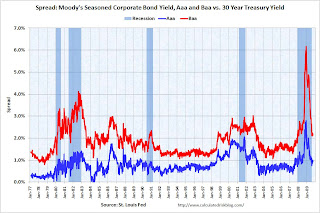
 The third graph shows the spread between 30 year Moody's Aaa and Baa rated bonds and the 30 year treasury.
The spread has decreased sharply, but the spreads are still high, especially for lower rated paper.
The Moody's data is from the St. Louis Fed:
Moody's tries to include bonds with remaining maturities as close as possible to 30 years. Moody's drops bonds if the remaining life falls below 20 years, if the bond is susceptible to redemption, or if the rating changes.


