by Calculated Risk on 9/25/2009 10:00:00 AM
Friday, September 25, 2009
New Home Sales Flat in August
The Census Bureau reports New Home Sales in August were at a seasonally adjusted annual rate (SAAR) of 429 thousand. This is a slight increase from the revised rate of 426 thousand in July (revised from 433 thousand). Click on graph for larger image in new window.
The first graph shows monthly new home sales (NSA - Not Seasonally Adjusted).
Note the Red columns for 2009. Sales in August 2009 were the same as August 2008. This is the 4th lowest sales for August since the Census Bureau started tracking sales in 1963.
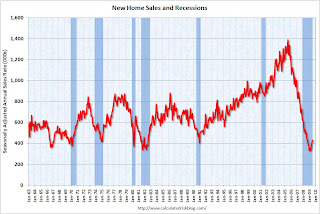
In August 2009, 38 thousand new homes were sold (NSA); the record low was 34 thousand in August 1981; the record high for August was 110 thousand in 2005. The second graph shows New Home Sales vs. recessions for the last 45 years. New Home sales fell off a cliff, but are now 30% above the low in January.
Sales of new one-family houses in August 2009 were at a seasonally adjusted annual rate of 429,000 ...And another long term graph - this one for New Home Months of Supply.
This is 0.7 percent (±16.2%)* above the revised July rate of 426,000, but is 3.4 percent (±13.3%) below the August 2008 estimate of 444,000.
 There were 7.3 months of supply in August - significantly below the all time record of 12.4 months of supply set in January.
The seasonally adjusted estimate of new houses for sale at the end of August was 262,000. This represents a supply of 7.3 months at the current sales rate.
 The final graph shows new home inventory.
 Note that new home inventory does not include many condos (especially high rise condos), and areas with significant condo construction will have much higher inventory levels.
Months-of-supply and inventory have both peaked for this cycle, and new homes sales has probably also bottomed for this cycle. However any further recovery in sales will likely be modest because of the huge overhang of existing homes for sale.
I'll have more later ...


