by Calculated Risk on 10/25/2009 02:49:00 PM
Sunday, October 25, 2009
Summary and more ...
It will be a busy week ... a few coming highlights:
A few articles and graphs from last week:
 Click on graph for larger image in new window.
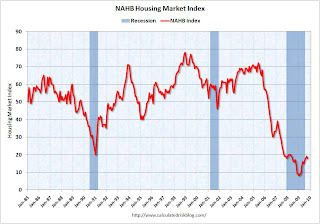
This graph shows the builder confidence index from the National Association of Home Builders (NAHB).
The housing market index (HMI) decreased to 18 in October from 19 in September. The record low was 8 set in January. Note that Traffic of Prospective Buyers declined sharply.
This is still very low - and this is what I've expected - a long period of builder depression.
From NAHB: Builder Confidence Decreases Slightly in October
 This graph shows a comparison of the Moodys/REAL Commercial Property Price Index (CPPI) and the Case-Shiller composite 20 index. CRE prices only go back to December 2000.
The Case-Shiller Composite 20 residential index is in blue (with Dec 2000 set to 1.0 to line up the indexes).
This shows residential leading CRE (although we usually talk about residential investment leading CRE investment, but in this case also for prices), and this also shows that prices tend to fall faster for CRE than for residential.
From Bloomberg: U.S. Commercial Property Values Fall 3% in August
The Moody’s/REAL Commercial Property Price Indices fell 3 percent in August from July, bringing the market’s decline to almost 41 percent since its peak in October 2007, Moody’s Investors Service said in a statement today.From Moody’s: CRE Prices Off 41 Percent from Peak, Off 3% in August
 Total housing starts were at 590 thousand (SAAR) in September, up 0.5% from the revised August rate, and up sharply from the all time record low in April of 479 thousand (the lowest level since the Census Bureau began tracking housing starts in 1959). Starts had rebounded to 590 thousand in June, and have move sideways for four months.
Single-family starts were at 501 thousand (SAAR) in September, up 3.9% from the revised August rate, and 40 percent above the record low in January and February (357 thousand). Just like for total starts, single-family starts have been at this level for four months.
From Housing Starts in September: Moving Sideways
 This graph shows the Architecture Billings Index since 1996. The index has remained below 50, indicating falling demand, since January 2008.
Note: Nonresidential construction includes commercial and industrial facilities like hotels and office buildings, as well as schools, hospitals and other institutions.
Historically there is an "approximate nine to twelve month lag time between architecture billings and construction spending" on commercial real estate (CRE). This suggests further dramatic declines in CRE investment through most of 2010, if not longer.
From AIA: Architectural Billings Index Shows Contraction
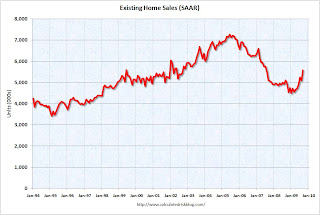
 This graph shows existing home sales, on a Seasonally Adjusted Annual Rate (SAAR) basis since 1993.
Sales in Sept 2009 (5.57 million SAAR) were 9.4% higher than last month, and were 9.2% higher than Sept 2008 (5.1 million SAAR).
From Existing Home Sales Increase in September
From Philly Fed State Coincident Indicators Show Widespread Weakness in September


