by Calculated Risk on 10/09/2009 08:37:00 AM
Friday, October 09, 2009
Trade Deficit Decreases Slightly in August
The Census Bureau reports:
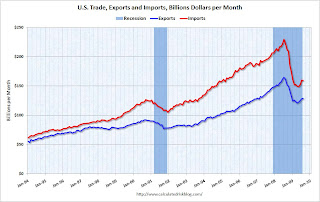
The ... total August exports of $128.2 billion and imports of $158.9 billion resulted in a goods and services deficit of $30.7 billion, down from $31.9 billion in July, revised. August exports were $0.2 billion more than July exports of $128.0 billion. August imports were $0.9 billion less than July imports of $159.8 billion.
 Click on graph for larger image.
The first graph shows the monthly U.S. exports and imports in dollars through August 2009.
Imports were down in August, and exports increased slightly. On a year-over-year basis, exports are off 21% and imports are off 29%.
The second graph shows the U.S. trade deficit, with and without petroleum, through August.
 The blue line is the total deficit, and the black line is the petroleum deficit, and the red line is the trade deficit ex-petroleum products.
Import oil prices increased to $64.75 in August - up more than 50% from the prices in February (at $39.22) - and the sixth monthly increase in a row. Import oil prices will probably rise further in September.
It appears the cliff diving for U.S. trade is over. The weaker dollar is probably helping exports - and hurting imports.


