by Calculated Risk on 11/24/2009 12:10:00 PM
Tuesday, November 24, 2009
House Prices: Real Prices, Price-to-Rent, and Price-to-Income
Here are three key measures of house prices: Price-to-Rent, Price-to-Income and real prices based on the Case-Shiller quarterly national home price index.
Price-to-Rent
In October 2004, Fed economist John Krainer and researcher Chishen Wei wrote a Fed letter on price to rent ratios: House Prices and Fundamental Value. Kainer and Wei presented a price-to-rent ratio using the OFHEO house price index and the Owners' Equivalent Rent (OER) from the BLS.
Here is a similar graph through Q3 2009 using the Case-Shiller National Home Price Index (SA): Click on image for larger graph in new window.
This graph shows the price to rent ratio (Q1 1987 = 1.0) for the Case-Shiller national Home Price Index. For rents, the national Owners' Equivalent Rent from the BLS is used.
Looking at the price-to-rent ratio based on the Case-Shiller index, the adjustment in the price-to-rent ratio is mostly behind us as of Q3 2009 on a national basis. However this ratio could easily decline another 5% to 10% or so, and with rents now falling, prices could fall even more.
Notice the price-to-rent ratio is currently almost as high as during the late '80s housing bubble.
Price-to-Income:
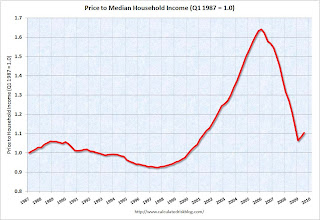
The second graph shows the price-to-income ratio: This graph is based off the Case-Shiller national index, and the Census Bureau's median income tables, and flat for 2009.
Using national median income and house prices provides a gross overview of price-to-income (it would be better to do this analysis on a local area). However this does shows that the price-to-income is still too high, and that this ratio needs to fall another 10% or so. A further decline in this ratio could be a combination of falling house prices and/or rising nominal incomes.
Real Prices This graph shows the real and nominal house prices based on the Case-Shiller national index. (Q1 2000 = 100 for nominal index)
Nominal prices are adjusted using CPI less Shelter.
The Case-Shiller real prices are still above prices in the '90s and perhaps real prices will decline another 10% or so. Prices can and do increase in real terms - especially in areas with land constraints. Also newer homes are larger than older homes - so the real prices are higher.
Summary
These measures are useful, but somewhat flawed. These measures give a general idea about house prices, but in the short run there are more important factors like inventory levels and credit issues. All of this data is on a national basis and it would be better to use local area price-to-rent, price-to-income and real prices.
It appears that house prices - in general - are still too high. However prices depend on the local supply and demand factors. In many lower priced bubble areas supply has declined sharply (because of the loan modification efforts and local moratoria), and demand was very strong in Q3 from the first-time home buyer frenzy and cash flow investors. This has pushed up prices at the low end, and suggests price might fall some again at the low end - although probably not to new lows.
However in the mid-to-high end of the bubble areas - with significant supply and little demand - prices are still too high. And I expect further declines in those areas and probably nationwide (although this isn't as obvious as it was in 2005 since most of the price declines are over).


