by Calculated Risk on 11/22/2009 12:15:00 PM
Sunday, November 22, 2009
Summary and a Look Ahead
This will be a busy week for housing news starting with October existing home sales on Monday, Case-Shiller house prices on Tuesday, and New Home sales on Wednesday.
Existing home sales will probably be very high - close to a 5.8 million SAAR - because of the rush of first-time home buyers to receive the tax credit (before it was extended). This high level of activity is not good economic news - although some people might be fooled. The more important housing number will be New Home sales on Wednesday.
In other economic news, the Q3 GDP revision will be released on Tuesday, and the October Personal Income and Spending report will be released Wednesday.
Also the Q3 FDIC Quarterly Banking Report will probably be released this week. This report will likely show close to 500 problem banks at the end of Q3 (the Unofficial Problem Bank list is up to 513 banks), and the report will also show that the Deposit Insurance Fund (DIF) was at zero or negative. Note: this doesn't mean the FDIC is "bankrupt" or even out of cash - the DIF balance includes reserves against future losses.
And a summary ...
The increase in October was mostly a rebound from the decline in September.
 Click on graph for larger image in new window.
This graph shows retail sales since 1992. This is monthly retail sales, seasonally adjusted (total and ex-gasoline).
This shows that retail sales fell off a cliff in late 2008, and appear to have bottomed, but at a much lower level.
The red line shows retail sales ex-gasoline and shows there has been little increase in final demand.
 This graph shows Capacity Utilization. This series has increased for four straight months, and is up from the record low set in June (the series starts in 1967).
From the Fed: Industrial production and Capacity Utilization
Note: y-axis doesn't start at zero to better show the change.
This is just one month, but the recovery in industrial production slowed in October.
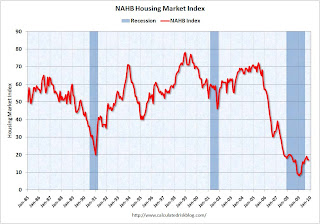
 This graph shows the builder confidence index from the National Association of Home Builders (NAHB).
The housing market index (HMI) was at 17 in November. October was revised down from 18 to 17. The record low was 8 set in January. This is very low - and this is what I've expected - a long period of builder depression.
Note: any number under 50 indicates that more builders view sales conditions as poor than good.
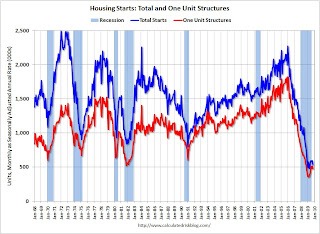
 Total housing starts were at 529 thousand (SAAR) in October, down 10.6% from the revised September rate, and up from the all time record low in April of 479 thousand (the lowest level since the Census Bureau began tracking housing starts in 1959). Starts had rebounded to 590 thousand in June, and have move sideways (or down) for five months.
Single-family starts were at 476 thousand (SAAR) in October, down 6.8% from the revised September rate, and 33 percent above the record low in January and February (357 thousand). Just like for total starts, single-family starts have been at this level for five months.
And some other economic stories
 This graph shows the delinquency and 'in foreclosure' rates for all prime mortgage loans. Prime loan delinquencies are clearly a growing problem.
MBA Chief Economist Jay Brinkmann said he expects the unemployment rate to peak in Q1 or Q2 2010, and delinquencies to peak sometime after the unemployment rate peaks. He now expects foreclosures to peak in early 2011 because a longer trailing effect than usual as the unemployment rate stays fairly high, and prime borrowers hang on before defaulting.
Bank Failures
The FDIC closed one bank on Friday, bringing the total for 2009 to 124.
Best wishes to all.


