by Calculated Risk on 12/20/2009 02:02:00 PM
Sunday, December 20, 2009
Weekly Summary and a Look Ahead
Existing home sales will be released on Tuesday (probably around 6.3 SAAR, the highest level since the end of the bubble). New Home sales will be released on Wednesday (probably around 430 thousand SAAR). Of course the number that matters for the economy is new home sales ...
In other economic news, the BEA will release the final Q3 GDP on Tuesday, and Personal Income and Outlays for November on Wednesday (this will give a good estimate for Q4 PCE growth). Durable goods will be released Thursday.
Also the Chicago Fed National Activity Index will be released Monday, and Moody’s/REAL Commercial Property Price Indices will probably be released early in the week.
A busy holiday week! Note: I'll be in town this year between Christmas and New Year's day, and there will be some interesting data that week too.
And a summary of last week ...
 Click on graph for larger image in new window.
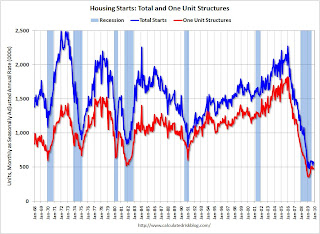
Total housing starts were at 574 thousand (SAAR) in November, up 8.9% from the revised October rate, and up from the all time record low in April of 479 thousand (the lowest level since the Census Bureau began tracking housing starts in 1959). Starts had rebounded to 590 thousand in June, and have moved mostly sideways for six months.
Single-family starts were at 482 thousand (SAAR) in November, up 2.1% from the revised October rate, and 35 percent above the record low in January and February (357 thousand). Just like for total starts, single-family starts have been at this level for six months.
Here is the Census Bureau report on housing Permits, Starts and Completions.
 This graph shows the builder confidence index from the National Association of Home Builders (NAHB).
The housing market index (HMI) was at 16 in December. This is a decline from 17 in November. The record low was 8 set in January.
This is very low - and this is what I've expected - a long period of builder depression.
Note: any number under 50 indicates that more builders view sales conditions as poor than good.
The American Institute of Architects’ Architecture Billings Index declined to 42.8 in November from 46.1 in October. Any reading below 50 indicates contraction.
"There continues to be a lot of uncertainty in the construction industry that likely will delay new projects in the near future," said Kermit Baker, chief economist at the American Institute of Architects.
 This graph shows the Architecture Billings Index since 1996. The index has remained below 50, indicating falling demand, since January 2008.
Historically there is an "approximate nine to twelve month lag time between architecture billings and construction spending" on non-residential construction. This suggests further significant declines in CRE investment through 2010, and probably longer.
Note: Nonresidential construction includes commercial and industrial facilities like hotels and office buildings, as well as schools, hospitals and other institutions.
 From the Fed: Industrial production and Capacity Utilization: "Industrial production increased 0.8 percent in November after having been unchanged in October. Manufacturing production advanced 1.1 percent, with broad-based gains among both durables and nondurables. ... At 99.4 percent of its 2002 average, total industrial production was 5.1 percent below its level of a year earlier. Capacity utilization for total industry moved up 0.7 percentage point to 71.3 percent, a rate 9.6 percentage points below its average for the period from 1972 through 2008."
 This graph shows Capacity Utilization. This series is up from the record low set in June (the series starts in 1967), and still well below the level of last year.
Note: y-axis doesn't start at zero to better show the change.
[R]ating agencies downgraded the public debt of Greece and warned about the outlook for several others. Greece could become the first developed country since 1948 to default on its debt, thanks to a deficit running at more than 12 percent of GDP and few signs that the government is willing or able to cut it. More seriously, Standard & Poor's last week slapped a negative outlook on Spain, a much larger economy.
Best wishes to all.


