by Calculated Risk on 1/04/2010 03:38:00 PM
Monday, January 04, 2010
Employment Week: Census and ISM
This will be busy week for employment related reports culminating with the BLS report on Friday. Here is some info on the impact of Census 2010 on employment, and the relationship between the ISM manufacturing report and BLS reported manufacturing payroll jobs. Click on photo for hi-res image in new window.
The Census Bureau kicked off the Census 2010 road tour today.
During the next four months, the tour will be part of the largest civic outreach and awareness campaign in U.S. history -- stopping and exhibiting at more than 800 events nationwide.Of course most of the Census will be conducted by mail in March, with followup visits for non-respondents. As we discussed on Friday, the Census Bureau will hire temporary census takers for most of the followup work (See: Impact of Census on Employment and Unemployment Rate).
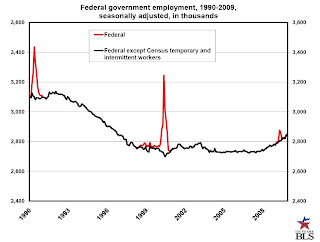
The key point is that Census 2010 will boost employment in March, April and especially in May. And this boost will mostly be unwound over the period June through September. The Census gives, and the Census takes.
 To track the impact on employment, the BLS provides a monthly report of Census hiring. This graph is from the BLS report and shows the historical impact of the Census on Federal Government employment.
There was a small spike in employment in April 2009, and currently the decennial census has little impact on employment. This will be something to check every month - especially from March through September.
And from the ISM Manufacturing report this morning on employment:
ISM's Employment Index registered 52 percent in December, which is 1.2 percentage points higher than the 50.8 percent reported in November. This is the third month of growth in manufacturing employment, following 14 consecutive months of decline. An Employment Index above 49.7 percent, over time, is generally consistent with an increase in the Bureau of Labor Statistics (BLS) data on manufacturing employment.The following graph shows the ISM Manufacturing Employment Index vs. the BLS reported monthly change in manufacturing employment (as a percent of manufacturing employment).
emphasis added
The graph includes data from 1948 through 2009. The earlier period (1948 - 1988) is in red, and the last 20 years is in blue.
 This shows that the ISM employment index is related to changes in BLS employment.
The relationship is noisy, and the equation is for just the last 20 years. This suggest the ISM employment index of about 51.3 is consistent with an increase in BLS reported manufacturing employment. This is higher than the ISM estimate that appears to be based more on older data.


