by Calculated Risk on 2/21/2010 12:12:00 PM
Sunday, February 21, 2010
Weekly Summary and a Look Ahead
Update: The FDIC Quarterly Banking Profile (Q4) will probably be released mid-week (ht Greg)
This will be a busy week for economic data highlighted by several key economic releases for both residential and commercial real estate: Case-Shiller house prices, new home sales, existing home sales, the Moodys' commercial property price index and the CRE related Architecture Billings Index will all be released this week.
On Tuesday, the S&P Case-Shiller House Price Index for December (actually three month average of Oct, Nov, and Dec) and the Q4 National Index will be released. The consensus is for the Composite 20 Index to have declined 3.1% from Dec 2008 - or basically flat from November to December (seasonally adjusted).
On Wednesday, the Census Bureau will report on New Home Sales for January. The consensus is for an increase to about 360 thousand (SAAR), from 342 thousand in December. Also the February AIA Architecture Billings Index will be released, and this will probably show a continued contraction in commercial real estate architectural billings (a leading indicator for non-residential construction). Also on Wednesday, Fed Chairman Ben Bernanke will provide the Semiannual Monetary Policy Report to the House Committee on Financial Services.
On Thursday, the Durable Goods report will be released, and the closely watched weekly report on initial unemployment claims. I also expect the Moodys/REAL Commercial Property Price Index for December will be released.
On Friday, the first revision to the Q4 GDP report will be released (consensus is for unchanged from the initial report of 5.7% GDP growth annualized in Q4), the Chicago Purchasing Managers' Index for February (consensus is for continued expansion, but a decline to 60 from 61.5 last month), and Existing Home Sales for January. Consensus is for a 1% increase in existing home sale to 5.5 million (SAAR) from 5.45 million in December (I'll take the under).
There will be several Fed speeches during the week, and probably more bank failures announced on Friday.
And a summary of last week ...
 Click on graph for larger image in new window.
Total housing starts were at 591 thousand (SAAR) in January, up 2.8% from the revised December rate, and up 24% from the all time record low in April 2009 of 479 thousand (the lowest level since the Census Bureau began tracking housing starts in 1959). Starts had rebounded to 590 thousand in June, and have moved mostly sideways for eight months.
Single-family starts were at 484 thousand (SAAR) in January, up 1.5% from the revised December rate, and 36% above the record low in January and February 2009 (357 thousand). Just like for total starts, single-family starts have been at about this level for eight months.
 This graph shows the builder confidence index from the National Association of Home Builders (NAHB).
Note: any number under 50 indicates that more builders view sales conditions as poor than good.
The housing market index (HMI) was at 17 in February. This is an increase from 15 in January.
The record low was 8 set in January 2009. This is still very low - and this is what I've expected - a long period of builder depression. The HMI has been in the 15 to 19 range since May.
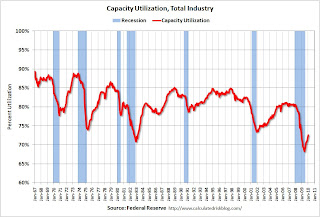
 From the Fed: "Industrial production increased 0.9 percent in January following a gain of 0.7 percent in December. ... The capacity utilization rate for total industry rose 0.7 percentage point to 72.6 percent, a rate 8.0 percentage points below its average from 1972 to 2009."
This graph shows Capacity Utilization. Capacity utilization at 72.6% is still far below normal - and far below the pre-recession levels of 80.5% in November 2007.
Note: y-axis doesn't start at zero to better show the change.
Also - this is the highest level for industrial production since Dec 2008, but production is still 10.1% below the pre-recession levels at the end of 2007.
 This graph shows mortgage delinquencies by "bucket" (time deliquent).
Loans 30 days delinquent declined in Q4, but are still above the levels in 2007 - and at about the level of early 2008 - when prices were falling sharply.
The 60 day bucket also declined in Q4, but it is still above the levels of 2008.
The 90 day and 'in foreclosure' rates are at record levels. Obviously the lenders have been slow to start foreclosure proceedings and to actually foreclose.
 This graph shows the national LoanPerformance data since 1976. January 2000 = 100.
The national average of home prices declined 1.0 percent in December 2009 compared to November 2009. The index is off 3.7% over the last year, and off 28.2% from the peak.
The index has declined for four consecutive months.
This is the house price indicator used by the Fed.
Best wishes to all.


