by Calculated Risk on 3/20/2010 09:38:00 AM
Saturday, March 20, 2010
Bank Failure Update
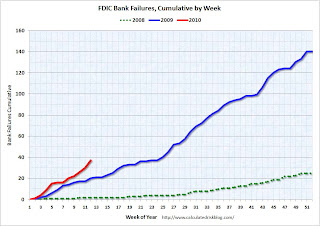
There have been 205 bank failures in this cycle (starting in 2007):
| FDIC Bank Failures by Year | 2007 | 3 |
|---|---|
| 2008 | 25 |
| 2009 | 140 |
| 2010 | 37 |
| Total | 205 |
 Click on graph for larger image in new window.
The first graph shows bank failures by week in 2008, 2009 and 2010.
The FDIC started fast in 2010, but slowed down when the snow storm hit D.C. - now it looks like the pace is picking back up again.
My (easy) prediction is the FDIC will close more banks in 2010 than in 2009 (more than 140), but fewer banks than in 1989 - peak of the S&L crisis (534 banks).
 The second graph shows bank failures by year since the FDIC was started.
The 140 bank failures last year was the highest total since 1992 (181 bank failures).
For those interested in bank failures by number of institutions and assets, the December Congressional Oversight Panel’s Troubled Asset Relief Program report through Nov 30th for 2009 (see page 45).


