 Click on graph for larger image in new window.
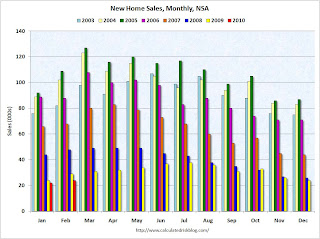
The first graph shows monthly new home sales (NSA - Not Seasonally Adjusted).
Note the Red columns for 2010. In February 2010, 24 thousand new homes were sold (NSA).
This is below the previous record low of 29 thousand hit three times; in February 2009, 1982 and 1970.
 The second graph shows New Home Sales vs. recessions for the last 45 years. New Home sales fell off a cliff, but after increasing slightly, are now 6% below the previous record low in January 2009.
 Sales of new single-family houses in February 2010 were at a seasonally adjusted annual rate of 308,000, according to estimates released jointly today ... This is 2.2 percent (±15.3%)* below the revised January rate of 315,000 and is 13.0 percent (±12.2%) below the February 2009 estimate of 354,000.And another long term graph - this one for New Home Months of Supply.
 There were 9.2 months of supply in February. Rising, but still significantly below the all time record of 12.4 months of supply set in January 2009.
The seasonally adjusted estimate of new houses for sale at the end of February was 236,000. This represents a supply of 9.2 months at the current sales rate.
 The final graph shows new home inventory.
 Note that new home inventory does not include many condos (especially high rise condos), and areas with significant condo construction will have much higher inventory levels.
New home sales are far more important for the economy than existing home sales, and new home sales will remain under pressure until the overhang of excess housing inventory declines much further. Obviously this is another extremely weak report.