by Calculated Risk on 4/14/2010 03:28:00 PM
Wednesday, April 14, 2010
Rail Traffic increases in March
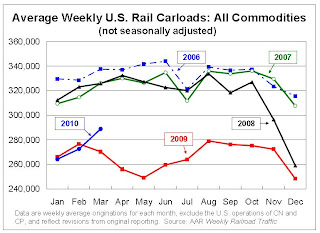
From the Association of American Railroads: Rail Time Indicators. The AAR reports traffic in March 2010 was up 7.5% compared to March 2009 - the first year-over-year increase since July 2008 - although traffic was still 11.5% lower than in March 2008.
This graph shows U.S. average weekly rail carloads. Traffic increased in 16 of the 19 major commodity categories YoY.
From AAR:
• On a non-seasonally adjusted basis, U.S. freight railroads originated 1,443,967 carloads in March 2010, up 7.5% (100,624 carloads) from March2009 and the first year-over-year increase since July 2008(see chart)The graph above shows that rail traffic collapsed in November 2008, and now nine months into the recovery, traffic hasn't even recovered half way. This is clearly not a "V-shaped" recovery - this is far more moderate and sluggish (although the pickup in March traffic was sharp).
• On a seasonally adjusted basis, U.S. carloads in March 2010 were up 3.9% from February 2010.
• Note, though, that carloads in March 2010 were still 11.5% lower than they were in March 2008, and in all 19 commodity categories carloads were lower in March 2010 than they were in March 2008. Railroads need many more monthly increases to get back to where they were prior to the downturn.
excerpts with permission
 The second graph from the AAR report shows lumber rail traffic compared to U.S. housing starts.
From the AAR:
Seasonally-adjusted housing starts fell 5.9% in February 2010 to an annualized 575,000 from a revised 611,000 in January 2010. February 2010’s housing starts were almost the same as they were in February 2009. The bottom line is that the housing recession that’s now more than four years old shows no sign of ending.Residential investment is moving sideways with no recovery in sight.


