by Calculated Risk on 7/20/2010 08:30:00 AM
Tuesday, July 20, 2010
Housing Starts decline in June
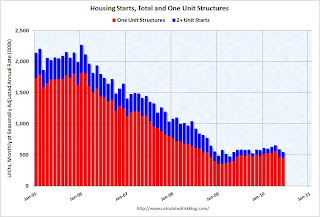
 Click on graph for larger image in new window.
Total housing starts were at 549 thousand (SAAR) in June, down 5% from the revised May rate of 578,000 (revised down from 593 thousand), and up 15% from the all time record low in April 2009 of 477 thousand (the lowest level since the Census Bureau began tracking housing starts in 1959).
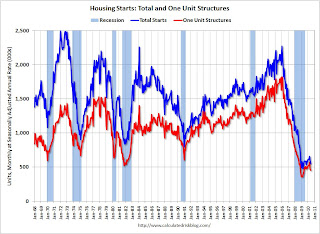
Single-family starts declined 0.7% to 454,000 in June. This is 26% above the record low in January 2009 (360 thousand).  The second graph shows total and single unit starts since 1968. This shows the huge collapse following the housing bubble, and that housing starts have mostly been moving sideways for over a year.
Here is the Census Bureau report on housing Permits, Starts and Completions.
Housing Starts:This is way below expectations of 580 thousand (I took the under!), and is good news for the housing market longer term (there are too many housing units already), but bad news for the economy and employment short term.
Privately-owned housing starts in June were at a seasonally adjusted annual rate of 549,000. This is 5.0 percent (±13.2%)* below the 13.2%) revised May estimate of 578,000 and is 5.8 percent (±10.5%)* below the June 2009 rate of 583,000.
Single-family housing starts in June were at a rate of 454,000; this is 0.7 percent (±10.7%)* below the revised May figure of 457,000.
Building Permits:
Privately-owned housing units authorized by building permits in June were at a seasonally adjusted annual rate of 586,000. This is 2.1 percent (±2.1%)* above the revised May rate of 574,000, but is 2.3 percent (±2.0%) below the June 2009 estimate of 600,000.
Single-family authorizations in June were at a rate of 421,000; this is 3.4 percent (±1.8%) below the revised May figure of 436,000.


