by Calculated Risk on 8/15/2010 11:45:00 AM
Sunday, August 15, 2010
Weekly Summary August 15th
Note: I'm going to split the weekly summary and the schedule for the coming week into two posts - sometimes one post was too long!
The big story of last week was that the Fed acknowledged the weaker U.S. economy and announced that they will reinvest maturing MBS into Treasury securities.
From the FOMC statement:
[T]he pace of recovery in output and employment has slowed in recent months [and] the pace of economic recovery is likely to be more modest in the near term than had been anticipated.The Fed's goal (according to the technical note from the NY Fed) is to "maintain the face value of outright holdings of domestic securities" at approximately $2.054 trillion.
...
[T]he Committee will keep constant the Federal Reserve's holdings of securities at their current level by reinvesting principal payments from agency debt and agency mortgage-backed securities in longer-term Treasury securities.
 Click on graph for larger image in new window.
The red line on this graph is the amount of outright holdings on the Fed's balance sheet. The dashed line is the new target level for quantitative neutrality.
The outright holdings were expected to fall by about $200 billion by the end of 2011 (some have estimated as high as $400 billion), and that would represent tightening in the face of high unemployment and below target inflation.
NY Fed FAQs: Reinvestment of Principal Payments on Agency Debt and Agency Mortgage-Backed Securities in Treasuries
And from the NY Fed: New York Fed Plans to Buy $18 billion in Treasuries over the next month
On a monthly basis, retail sales increased 0.4% from June to July (seasonally adjusted, after revisions), and sales were up 5.5% from July 2009. Retail sales increased 0.2% ex-autos.
 This graph shows retail sales since 1992.
 This is monthly retail sales, seasonally adjusted (total and ex-gasoline).
Retail sales are up 8.1% from the bottom, but still off 4.5% from the pre-recession peak.
This was close to expectations, but retail sales are still below the March 2010 level (moving sideways for four months).
The combined REO (Real Estate Owned) inventory for Fannie, Freddie and the FHA increased by 13% in Q2 2010 from Q1 2010. The REO inventory (lender Real Estate Owned) increased 74% compared to Q2 2009 (year-over-year comparison).
 This graph shows the REO inventory for Fannie, Freddie and FHA through Q2 2010.
The REO inventory for the "Fs" has increased sharply over the last year, from 135,868 at the end of Q2 2009 to 236,338 at the end of Q2 2010.
This is a new record for Fannie and Freddie; the FHA's REO inventory decreased slightly in Q2 2010.
Remember this is just a portion of the total REO inventory. Private label securities (PLS) and banks and thrifts also hold a substantial number of REOs.
From Diana Olick at CNBC: Foreclosure Math: Shadow Inventory Adds Up
Moody's estimates that private label repossessions stand at 203,665. ... "My best guess right now is that REO held by Fannie, Freddie, and FHA, and other government entities, and banks and thrifts is just under 600-thousand, but unfortunately it is on the rise," says [Thomas] Lawler.
The Census Bureau reports:
[T]otal June exports of $150.5 billion and imports of $200.3 billion resulted in a goods and services deficit of $49.9 billion, up from $42.0 billion in May, revised.This graph shows the U.S. trade deficit, with and without petroleum, through June.
 The blue line is the total deficit, and the black line is the petroleum deficit, and the red line is the trade deficit ex-petroleum products.
The increase in the deficit in June was unrelated to oil as the trade gap with China increased to $26.15 billion in June - the highest level since October 2008 and up sharply from last year.
Once again the imbalances have returned ... and July will probably be worse (see LA Port Traffic: Imports increase, Exports Flat)
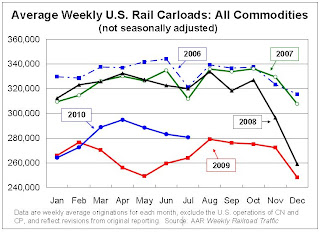
From the Association of American Railroads: Rail Time Indicators. The AAR reports traffic in July 2010 was up 4.1% compared to July 2009 - and traffic was 14.6% lower than in July 2008.
 This graph shows U.S. average weekly rail carloads (NSA). Traffic increased in 14 of 19 major commodity categories year-over-year.
As the graph above shows, rail traffic collapsed in November 2008, and now, a year into the recovery, traffic has only recovered part way.
Seasonally there is usually a decline in traffic in July, so seasonally adjusted traffic increased last month. However traffic is only up 4.1% compared to July 2009.
From the National Federation of Independent Business (NFIB): Small Business Economic Trends
 NFIB reported its optimism index fell 0.9 point to 88.1 in July. (Graph from NFIB)
Note: A large percentage of small businesses are in real estate related fields and that will keep optimism down.
And once again the key problem is lack of demand.
Best wishes to all.


