by Calculated Risk on 10/28/2010 05:45:00 PM
Thursday, October 28, 2010
House Prices have corrected to what year?
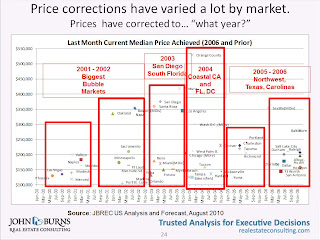
Housing consultant John Burns presented this slide as part of the UCLA Anderson Forecast this week:

John Burns used median prices for this slide. It shows that the "biggest bubble markets" are back to 2000 to 2002 median prices, whereas some areas are still at 2006 prices.
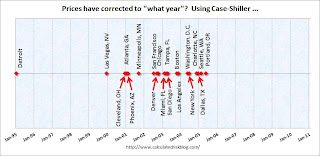
And here is a timeline for the 20 Case-Shiller cities:
 There is no y-axis because this is based on a price index (not median prices).
Detroit is back to 1995 prices, and some cities like Dallas, Portland and Seattle are only back to 2005 or 2006 prices (the bubble arrived later in the Northwest).


