by Calculated Risk on 11/24/2010 03:28:00 PM
Wednesday, November 24, 2010
Comments on October Personal Income and Outlays Report
The BEA released the Personal Income and Outlays report for October this morning.
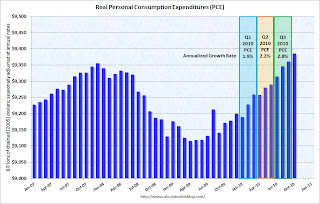
Personal income increased $57.6 billion, or 0.5 percent ... Personal consumption expenditures (PCE) increased $44.0 billion, or 0.4 percent.The following graph shows real Personal Consumption Expenditures (PCE) through October (2005 dollars). Note that the y-axis doesn't start at zero to better show the change.
...
Real PCE -- PCE adjusted to remove price changes -- increased 0.3 percent in October, compared with an increaseof 0.2 percent in September.
 Click on graph for large image.
The quarterly change in PCE is based on the change from the average in one quarter, compared to the average of the preceding quarter.
Even with no growth in November and December, PCE growth will be close to 2% in Q4, and it will probably be closer to 3% (annualized growth rate).
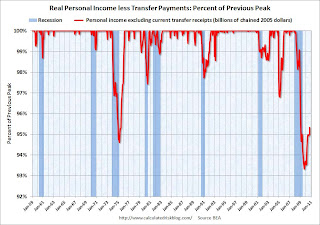
Also personal income less transfer payments increased sharply in October. This increased to $9,285.7 billion (SAAR, 2005 dollars) from $9,252.2 billion in September. This measure had stalled out over the summer.
 This graph shows real personal income less transfer payments as a percent of the previous peak. This has been slow to recover - and is still 4.7% below the previous peak - but is recovering again.
 Overall this was a fairly positive report, in line with consensus expectations, and suggests decent (but not robust) growth in October.


