Below is a summary of the previous week, mostly in graphs. Also the proposed tax legislation and the rise in mortgage rates (impacting refinance activity) were important stories last week.
• Trade Deficit decreased in October
 Click on graphs for larger image in graph gallery.
The first graph shows the monthly U.S. exports and imports in dollars through October 2010.
After trade bottomed in the first half of 2009, imports increased much faster than exports. However imports have slowed over the last few months. October exports were $4.9 billion more than in September and are at the highest level since August 2008.
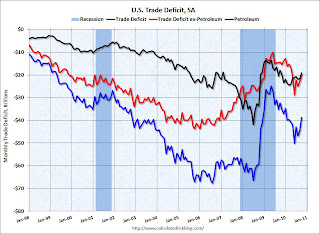
 The second graph shows the U.S. trade deficit, with and without petroleum, through October.
The blue line is the total deficit, and the black line is the petroleum deficit, and the red line is the trade deficit ex-petroleum products.
The trade deficit decreased in October to $38.7 billion, down from $44.6 billion in September.
• BLS: Job Openings increased sharply in October, low Labor Turnover
The following graph shows job openings (yellow line), hires (purple), Layoff, Discharges and other (red column), and Quits (light blue column) from the JOLTS.
 Notice that hires (purple) and total separations (red and blue columns stacked) are pretty close each month. When the purple line is above the two stacked columns, the economy is adding net jobs - when it is below the columns, the economy is losing jobs.
In October, about 4.047 million people lost (or left) their jobs, and 4.196 million were hired (this is the labor turnover in the economy) adding 149 thousand total jobs.
The good news was job openings increased from 3.0 million in September to 3.4 million in October, however overall labor turnover was still low.
• Consumer Sentiment increased in December
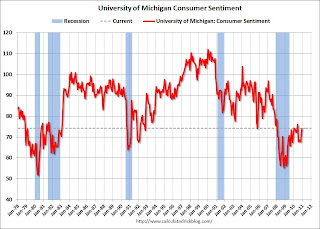
 The preliminary Reuters / University of Michigan consumer sentiment index increased to 74.2 in December from 71.6 in November. This was above the consensus forecast of 72.5.
 This is the highest level since June 2010, but sentiment is still at levels usually associated with a recession - and sentiment is well below the pre-recession levels.
In general consumer sentiment is a coincident indicator.
• Ceridian-UCLA: Diesel Fuel index increases slightly in November
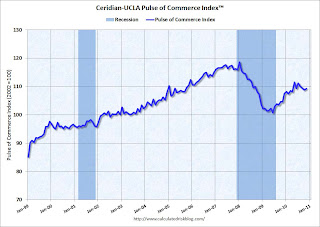
 This is the new UCLA Anderson Forecast and Ceridian Corporation index using real-time diesel fuel consumption data: Pulse of Commerce IndexTM. The data suggests the recovery has "stalled" since May.
"The Ceridian-UCLA Pulse of Commerce Index™ (PCI), a real-time measure of the flow of goods to U.S. factories, retailers, and consumers, grew 0.4 percent in November following three consecutive months of decline. The growth, while positive, is not enough to offset the 0.6 percent decline that the PCI saw the previous month, nor the 2.1 percent decline experienced in the PCI since July. Though on a year-over-year basis the PCI is up, the three month moving average has been declining for four months, suggesting relative weakness within the goods producing segments of the economy."
• Q3 Flow of Funds Report
The Federal Reserve released the Q3 2010 Flow of Funds report this week: Flow of Funds.
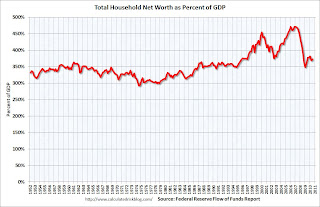
 This is the Households and Nonprofit net worth as a percent of GDP.
This includes real estate and financial assets (stocks, bonds, pension reserves, deposits, etc) net of liabilities (mostly mortgages). Note that this does NOT include public debt obligations.
Note that this ratio was relatively stable for almost 50 years, and then we saw the stock market and housing bubbles.
 This graph shows household real estate assets and mortgage debt as a percent of GDP.
 The Fed estimated that the value of household real estate fell $684 billion to $16.55 trillion in Q3 2010, from $17.2 trillion in Q2 2010. Mortgage debt declined by $65 billion in Q3. Mortgage debt has now declined by $488 billion from the peak.
Assets prices, as a percent of GDP, have fallen significantly and are not far above historical levels. However household mortgage debt, as a percent of GDP, is still historically very high, suggesting more deleveraging ahead for households.
• Other Economic Stories ...
• From the Association of American Railroads: AAR Reports November 2010 Rail Traffic Continues Mixed Progress
• From David Leonhardt at the NY Times: For Obama, Tax Deal Is a Back-Door Stimulus Plan
• From CoStar: Commercial Real Estate prices declined in October
• From Bloomberg: Mortgage Rates for U.S. Loans Jump to Five-Month High
• Unofficial Problem Bank list at 919 Institutions
Best wishes to all!