by Calculated Risk on 12/26/2010 08:29:00 AM
Sunday, December 26, 2010
Summary for Week ending December 25th
Note: here is the economic schedule for the coming week.
Below is a summary of the previous week, mostly in graphs.
• November Existing Home Sales: 4.68 million SAAR, 9.5 months of supply
 Click on graph for larger image in graph gallery.
This graph shows existing home sales, on a Seasonally Adjusted Annual Rate (SAAR) basis since 1993.
Sales in November 2010 (4.68 million SAAR) were 5.6% higher than last month, and were 27.9% lower than November 2009.
 According to the NAR, inventory decreased to 3.71 million in November from 3.86 million in October. Inventory is not seasonally adjusted and there is a clear seasonal pattern with inventory peaking in the summer and declining in the fall. Although inventory decreased from October to November, inventory increased 5.4% YoY in November.
The year-over-year increase in inventory is especially bad news because the reported inventory is very high (3.71 million), and the 9.5 months of supply in November is well above normal.
The bottom line: Sales were weak in November, and existing home sales will continue to be weak for some time. Inventory is very high, and the year-over-year increase in inventory is very concerning. The high level of inventory will continue to put downward pressure on house prices.
• New Home Sales weak in November
 This graph shows New Home Sales vs. recessions since 1963. The dashed line is the current sales rate.
The Census Bureau reported New Home Sales in November were at a seasonally adjusted annual rate (SAAR) of 290 thousand. This is up from a revised 275 thousand in October.
 Months of supply decreased to 8.2 in November from 8.8 in October. The all time record was 12.4 months of supply in January 2009. This is still high (less than 6 months supply is normal).
The 290 thousand annual sales rate for November is just above the all time record low in August (274 thousand). This was the weakest November on record and below the consensus forecast of 300 thousand. This was another very weak report.
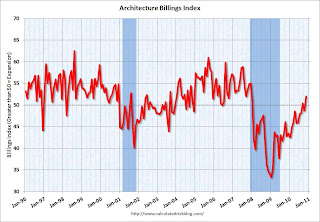
• AIA: Architecture Billings Index showed expansion in November
Note: This index is a leading indicator for new Commercial Real Estate (CRE) investment.
 This graph shows the Architecture Billings Index since 1996.
From the American Institute of Architects: Firm Billings Rebound in November. "At 52.0, the AIA’s Architecture Billings Index (ABI) recorded a three point gain from the previous month, and reached its strongest level since December 2007."
According to the AIA, there is an "approximate nine to twelve month lag time between architecture billings and construction spending" on non-residential construction. So this indicator suggests the drag from CRE investment will end next summer.
• Moody's: Commercial Real Estate Prices increased in October
Moody's reported this week that the Moody’s/REAL All Property Type Aggregate Index increased 1.3% in October. Note: Moody's CRE price index is a repeat sales index like Case-Shiller - but there are far fewer commercial sales - and that can impact prices and make the index very volatile.
Below is a comparison of the Moodys/REAL Commercial Property Price Index (CPPI) and the Case-Shiller composite 20 index. Beware of the "Real" in the title - this index is not inflation adjusted.
 CRE prices only go back to December 2000. The Case-Shiller Composite 20 residential index is in blue (with Dec 2000 set to 1.0 to line up the indexes).
According to Moody's, CRE prices are about 42% below the peak in 2007.
It is important to remember that the number of transactions is very low and there are a large percentage of distressed sales.
• Other Economic Stories ...
• From Reuters: Fitch cuts Portugal rating one notch on debt levels
• From Bloomberg: Hungary's Credit Rating Cut by Fitch on Budget; Debt Grade Nears `Abyss'
• From John Carney at CNBC: Bank of America Loses Key Battle In Mortgage Fraud Fight
• From the American Trucking Association: ATA Truck Tonnage Index Fell 0.1 Percent in November
• DOT: Vehicle miles driven increased in October
• From Tom Lawler: Overall Housing Stock Growth Likely to Slow Even Further in 2011
Best wishes to all!


