[T]otal October exports of $158.7 billion and imports of $197.4 billion resulted in a goods and services deficit of $38.7 billion, down from $44.6 billion in September, revised. October exports were $4.9 billion more than
September exports of $153.8 billion. October imports were $0.9 billion less than September imports of $198.4 billion.
 Click on graph for larger image.
The first graph shows the monthly U.S. exports and imports in dollars through October 2010.
After trade bottomed in the first half of 2009, imports increased much faster than exports. October exports were $4.9 billion more than in September and are at the highest level since August 2008.
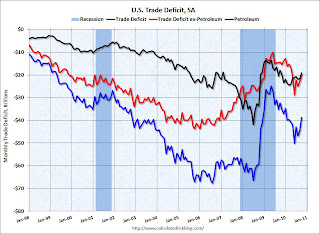
The second graph shows the U.S. trade deficit, with and without petroleum, through October.
 The blue line is the total deficit, and the black line is the petroleum deficit, and the red line is the trade deficit ex-petroleum products.
The petroleum deficit decreased slightly in September - even with higher prices - and the trade deficit with China decreased (NSA).
After stalling over the summer, it appears exports are growing again. I expect the dollar volume of oil imports to rise over the next couple of months since oil prices have increased sharply since October.