by Calculated Risk on 2/12/2011 12:30:00 PM
Saturday, February 12, 2011
Participation Rate Update
Last year I looked at some of the cyclical and long term trends for the participation rate: Labor Force Participation Rate: What will happen?. I concluded that most of the decline in the participation rate is due to changes in demographics - not cyclical. I also noted that it is possible that long term trends - especially more older workers participating in the labor force - could push the participation rate up to 66% by 2015 before the participation rate would start to decline again.
Sven Jari Stehn at Goldman Sachs put out a research note last night arguing there would only be a small increase in the participation rate over the next two years as the economy recovers:
• Economic recovery should draw some additional workers into the labor force in the next 1-2 years. But there is little evidence for the idea that an “unduly” low participation rate is masking an even weaker labor market than indicated by the 9% unemployment rate. Instead, we find that most of the drop in participation in recent years reflects changes in the underlying demographics and the “normal” effects of the economic cycle (i.e., the fact that a 9% unemployment rate in itself is very high). Our analysis implies that the overall labor force participation rate will edge up by ¼ to ½ percentage point over the next two years. If so, job growth will need to average 200,000 jobs per month to push the unemployment rateThis analysis is important because it suggests the large decline in the participation rate is mostly because of demographics, and only a portion of because of the decline because of cyclical effects. So the bounce back will probably not be as large as some people expect.
down to 8% by the end of 2012, consistent with our forecast.
• These projections are based on our analysis of the structural and cyclical drivers of labor force participation. Population aging should push down the participation rate as older individuals are less likely to participate in the labor force than their younger counterparts. “Secular trends” in the participation profile of different population groups are likely to reinforce this downward trend, as participation of young workers and (to a lesser extent) of prime-age men continues to decline. In combination these structural trends should push down the participation rate by around ¼ point per year.
• The economic recovery, however, should attract some workers back into the labor force and thus offset the demographic trends above in the next couple of years. Taken together our analysis projects a participation rate of 64.7% at the end of 2012—up a modest 0.4 point from the current rate.
Here is a look at some the long term trends (updating graphs through January 2011):
 Click on graph for larger image in graph gallery.
This graph shows the changes in the participation rates for men and women since 1960 (in the 25 to 54 age group - the prime working years).
The participation rate for women increased significantly from the mid 30s to the mid 70s and has mostly flattened out. The participation rate for men has decreased from the high 90s to 88.6% in January 2011.
There will probably be some "bounce back" for men (some of the recent decline is probably cyclical), but the long term trend is down.
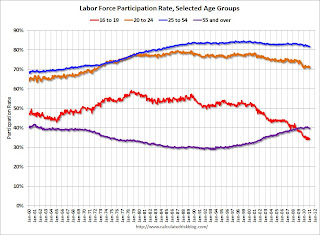
 This graph shows that participation rates for several key age groups.
There are a few key long term trends:
• The participation rate for the '16 to 19' age group has been falling for some time (red).
• The participation rate for the 'over 55' age group has been rising since the mid '90s (purple), although this has stalled out a little recently (perhaps cyclical).
• The participation rate for the '20 to 24' age group appears to be falling too (perhaps more education before joining the labor force). Also note the sharp decline over the last couple of years - that will probably turn around quickly as the job market improves.
 The third graph shows the participation rate for several over 55 age groups. The red line is the '55 and over' total seasonally adjusted. All of the other age groups are Not Seasonally Adjusted (NSA).
The participation rate is generally trending up for all age groups. And this might push the overall participation rate up over the next 5 years. After that the 'over 55' participation rate will probably start to decline as the oldest baby boomers move into even older age groups.
If these trends for older workers continue, the participation rate might rise a little further than Sven Jari Stehn is forecasting. But the key point is most of the recent decline in the participation rate is due to demographics and not because of cyclical effects - although there will probably be some small bounce back of the next couple of years.


