by Calculated Risk on 3/21/2011 11:30:00 AM
Monday, March 21, 2011
Existing Home Inventory decreases 1.2% Year over Year
Earlier the NAR released the existing home sales data for February; here are a couple more graphs ...
The first graph shows the year-over-year (YoY) change in reported existing home inventory and months-of-supply. Inventory is not seasonally adjusted, so it really helps to look at the YoY change.
 Click on graph for larger image in graph gallery.
Although inventory increased from January to February (as usual), inventory decreased 1.2% YoY in February. This is a small YoY decrease and follows six consecutive month of year-over-year increases in inventory.
Inventory should increase over the next few months (the normal seasonal pattern), and the YoY change is something to watch closely this year. Inventory is already very high, and further YoY increases in inventory would put more downward pressure on house prices.
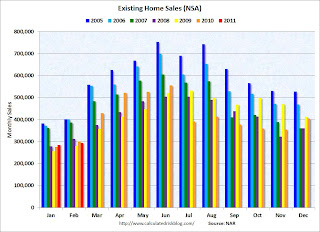
 The second graph shows existing home sales Not Seasonally Adjusted (NSA).
The red columns in January and February are for 2011.
Sales NSA were about the same level as the last three years. February is usually the second weakest month of the year for existing home sales (close to January). The real key is what happens in the spring and summer - and March sales and inventory will give a clearer picture of existing home sales activity.
The bottom line: Sales decreased in February (using the old method to estimate sales), possibly due to a decrease in investor purchases of distressed properties at the low end and possibly some weather factors. The NAR noted "Investors accounted for 19 percent of sales activity in February, down from 23 percent in January; they were 19 percent in February 2010."
The NAR also mentioned: "Distressed homes – sold at discount – accounted for a 39 percent market share in February, up from 37 percent in January and 35 percent in February 2010." A higher percentage of distressed sales probably means lower prices - and we should expect the repeat sales indexes to show further price declines in February.
Note: The Case-Shiller prices index will be released next Tuesday (March 29th), and will be for January (average of three months) - and the NAR report suggests further price declines in February.
March is the beginning of the selling season for existing homes, so the next report will be much more important.


