by Calculated Risk on 3/02/2011 06:29:00 PM
Wednesday, March 02, 2011
Oil Prices and PCE
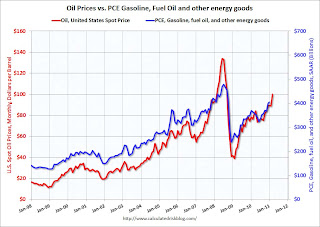
The following graph shows the monthly personal consumption expenditures (PCE) at a seasonally adjusted annual rate (SAAR) for gasoline, oil and other energy goods compared to the U.S. spot price for oil (monthly).
 Click on graph for larger image in graph gallery.
As oil prices fell sharply in late 2008, consumption of gasoline and other energy goods fell sharply too. On a quarterly basis, PCE, "Gasoline and other energy goods" peaked at $467 billion (SAAR) in Q3 2008, and fell sharply to $265 billion (SAAR) in Q1.
The sharp decline in oil prices provided a cushion for the U.S. economy in early 2009.
Now, with U.S. spot prices over $100 per barrel, gasoline and other energy goods PCE will probably come in around $425 billion (SAAR) in Q1 2011 (up from $379 billion (SAAR) in Q4 2010. This was already over $400 billion SAAR in January.
This is a drag on consumers of about $5 to $6 billion per month, at the current oil price, compared to the average for 2010.
Data sources: PCE from BEA underlying detail tables: Table 2.4.5U. Personal Consumption Expenditures by Type of Product
Oil prices from EIA: U.S. Spot Prices


