by Calculated Risk on 3/27/2011 09:27:00 AM
Sunday, March 27, 2011
Schedule for Week of March 27th
Yesterday:
• Here is the Summary for Week ending March 25th.
• Lawler: Census 2010 and Excess Vacant Housing Units
The key report for this week will be the March employment report to be released on Friday, April 1st.
Other key reports include the February Personal Income and Outlays report on Monday, the Case-Shiller house price index on Tuesday, the ISM manufacturing index on Friday, and vehicle sales also on Friday.
8:30 AM: Personal Income and Outlays for February. The consensus is for a 0.4% increase in personal income and a 0.6% increase in personal spending.
 Click on graph for larger image in graph gallery.
Real Personal Consumption Expenditures (PCE) - PCE adjusted for inflation - decreased 0.1 percent in January.
Using the February data we can obtain an early estimate for Q1 real PCE growth (annualized) using the two-month method (usually pretty close).
10:00 AM: Pending Home Sales for February. The consensus is for pending sales home sales to be flat (a leading indicator for existing home sales).
10:30 AM: Dallas Fed Manufacturing Survey for March. The Texas production index increased last month to 9.7 (from 0.2 in January).
9:00 AM: S&P/Case-Shiller Home Price Index for January. Although this is the January report, it is really a 3 month average of November, December and January.
 This graph shows the seasonally adjusted Composite 10 and Composite 20 indices through December (the Composite 20 was started in January 2000).
Prices are falling again, and the Composite 20 index will probably be close to a new post-bubble low in January. The consensus is for prices to decline about 0.4% in January; the seventh straight month of house price declines.
10:00 AM: Conference Board's consumer confidence index for March. The consensus is for a decrease to 65.0 from 70.4 last month due to world events and higher gasoline prices.
7:00 AM: The Mortgage Bankers Association (MBA) will release the mortgage purchase applications index. This index has been very weak over the last couple months suggesting weak home sales through the first few months of 2011.
8:15 AM: The ADP Employment Report for March. This report is for private payrolls only (no government). The consensus is for +205,000 payroll jobs in March, down slightly from the 217,000 reported in February.
8:30 AM: The initial weekly unemployment claims report will be released. The consensus is for a decrease to 380,000 from 382,000 last week.
9:45 AM: Chicago Purchasing Managers Index for March. The consensus is for a slight decrease to a still very strong 70.0 (down from 71.2 in March).
10:00 AM: Manufacturers' Shipments, Inventories and Orders for February. The consensus is for a 0.3% increase in orders.
11:00 AM: Kansas City Fed regional Manufacturing Survey for March. The index was at an all time high 19 in February.
8:30 AM: Employment Report for March.
 The consensus is for an increase of 195,000 non-farm payroll jobs in March, after an increase of 192,000 in February (that was partially "payback" for the weak January report).
 This graph shows the net payroll jobs per month (excluding temporary Census jobs) since the beginning of the recession. The estimate for March is in blue.
The consensus is for the unemployment rate to remain at 8.9% in March.
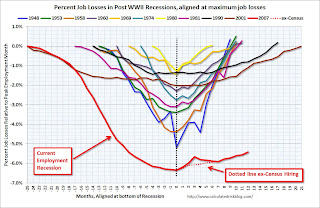
 The second employment graph shows the percentage of payroll jobs lost during post WWII recessions - aligned at maximum job losses.
This shows the severe job losses during the recent recession - there are currently 7.5 million fewer jobs in the U.S. than when the recession started.
10:00 AM: ISM Manufacturing Index for March. The consensus is for a slight decrease to 61.2 from the strong 61.4 in February. All of the regional manufacturing surveys showed continued expansion in March.
10:00 AM: Construction Spending for February. The consensus is for no change in construction spending.
All day: Light vehicle sales for March. Light vehicle sales are expected to decrease to 13.2 million (Seasonally Adjusted Annual Rate), from 13.4 million in February.
 This graph shows light vehicle sales since the BEA started keeping data in 1967. The dashed line is the February sales rate.
 Edmunds is forecasting: "Edmunds.com analysts predict that March’s Seasonally Adjusted Annualized Rate (SAAR) will be 13.07 million, down from 13.38 in February 2011."
Best wishes to All!


