by Calculated Risk on 4/15/2011 04:58:00 PM
Friday, April 15, 2011
First Look at 2012 Cost-Of-Living Adjustments and Maximum Contribution Base
The BLS reported this morning: "The Consumer Price Index for Urban Wage Earners and Clerical Workers (CPI-W) increased 3.0 percent over the last 12 months to an index level of 220.024 (1982-84=100). For the month, the index rose 1.1 percent ..."
CPI-W is the index that is used to calculate the Cost-Of-Living Adjustments (COLA). Here is an explanation ...
The calculation dates have changed over time (see Cost-of-Living Adjustments), but the current calculation uses the average CPI-W1 for the three months in Q3 (July, August, September) and compares to the average for the highest previous average of Q3 months. Note: this is not the headline CPI-U, and not seasonally adjusted.
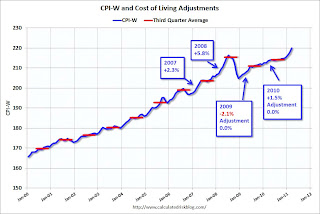
• In 2008, the Q3 average of CPI-W was 215.495. In the previous year, 2007, the average in Q3 of CPI-W was 203.596. That gave an increase of 5.8% for COLA for 2009.
• In 2009, the Q3 average of CPI-W was 211.013. That was a decline of 2.1% from 2008, however, by law, the adjustment is never negative so the benefits remained the same in 2010.
• In 2010, the Q3 average of CPI-W was 214.136. That was an increase of 1.5% from 2009, however the average was still below the Q3 average in 2008, so the adjustment was zero.
 Click on graph for larger image in graph gallery.
This graph shows CPI-W since January 2000. The red lines are the Q3 average of CPI-W for each year.
The COLA adjustment is based on the increase from Q3 of one year from the highest previous Q3 average. So a 2.3% increase was announced in 2007 for 2008, and a 5.8% increase was announced in 2008 for 2009.
In Q3 2009, CPI-W was lower than in Q3 2008, so there was no change in benefits for 2010. And CPI-W in Q3 2010 was also lower than in Q3 2008, so once again there was no change in benefits.
Currently CPI-W is above the Q3 2008 average. The recent increase is mostly because of the surge in oil prices. CPI-W could be very volatile this year - and will depend on energy prices - but if the current level holds, COLA would be around 2.1% for next year (the current 220.024 divided by the Q3 2008 level of 215.495).
This is very early - if oil prices fall sharply, COLA might be zero again.
Contribution and Benefit Base
The law prohibits an increase in the contribution and benefit base if COLA is not greater than zero. However if the there is even a small increase in COLA, the contribution base will be adjusted using the National Average Wage Index.
From Social Security: Cost-of-Living Adjustment Must Be Greater Than Zero
... ... any amount that is directly dependent for its value on the COLA would not increase. For example, the maximum Supplemental Security Income (SSI) payment amounts would not increase if there were no COLA.This is based on a one year lag. The National Average Wage Index is not available for 2010 yet, but wages probably didn't change much from 2009. If wages increased back to the 2008 level in 2010, and COLA is positive (seems likely right now), then the contribution base next year will be increased to around $109,000 from the current $106,800.
... if there were no COLA, section 230(a) of the Social Security Act prohibits an increase in the contribution and benefit base (Social Security's maximum taxable earnings), which normally increases with increases in the national average wage index. Similarly, the retirement test exempt amounts would not increase ...
Remember - this is an early look. What matters is CPI-W during Q3 (July, August and September).
(1) CPI-W usually tracks CPI-U (headline number) pretty well. From the BLS:
The Bureau of Labor Statistics publishes CPIs for two population groups: (1)the CPI for Urban Wage Earners and Clerical Workers (CPI-W), which covers households of wage earners and clerical workers that comprise approximately 32 percent of the total population and (2) the CPI for All Urban Consumers (CPI-U) ... which cover approximately 87 percent of the total population and include in addition to wage earners and clerical worker households, groups such as professional, managerial, and technical workers, the self- employed, short-term workers, the unemployed, and retirees and others not in the labor force.


