by Calculated Risk on 4/15/2011 09:15:00 AM
Friday, April 15, 2011
Industrial Production, Capacity Utilization increased in March
From the Fed: Industrial production and Capacity Utilization
Industrial production increased 0.8 percent in March and rose at an annual rate of 6.0 percent for the first quarter as a whole. Manufacturing output advanced 0.7 percent in March, its fourth consecutive month of strong expansion; factory production climbed at an annual rate of 9.1 percent in the first quarter. Outside of manufacturing, the output of mines rose 0.6 percent in March, while the output of utilities increased 1.7 percent after declining significantly in the preceding two months. At 93.6 percent of its 2007 average, total industrial production was 5.9 percent above its year-earlier level. The rate of capacity utilization for total industry rose 0.5 percentage point to 77.4 percent, a rate 3.0 percentage points below its average from 1972 to 2010.
 Click on graph for larger image in graph gallery.
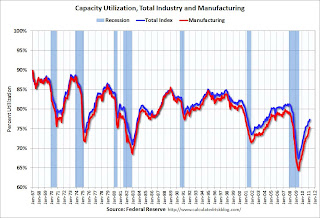
This graph shows Capacity Utilization. This series is up 10 percentage points from the record low set in June 2009 (the series starts in 1967).
Capacity utilization at 77.4% is still "3.0 percentage points below its average from 1972 to 2010" - and below the pre-recession levels of 81.2% in November 2007.
Note: y-axis doesn't start at zero to better show the change.
 The second graph shows industrial production since 1967.
Industrial production increased in March to 93.6, however February was revised down from 93.0 to 92.8. So the increase was reported at 0.8% but would have been 0.6% without the downward revision.
Production is still 7.0% below the pre-recession levels at the end of 2007.
The consensus was for a 0.5% increase in Industrial Production in March, and an increase to 77.4% (from 76.3%) for Capacity Utilization. So this was close to expectations.


