by Calculated Risk on 5/17/2011 08:30:00 AM
Tuesday, May 17, 2011
Housing Starts decline in April
 Click on graph for larger image in graph gallery.
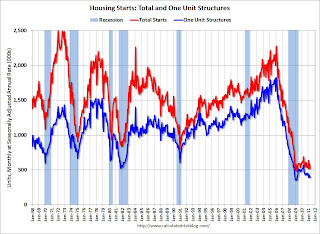
Total housing starts were at 523 thousand (SAAR) in April, down 10.6% from the revised March rate of 585 thousand.
Single-family starts decreased 5.1% to 394 thousand in April.
 The second graph shows total and single unit starts since 1968. This shows the huge collapse following the housing bubble, and that housing starts have mostly been moving sideways for over two years - with slight ups and downs due to the home buyer tax credit.
Here is the Census Bureau report on housing Permits, Starts and Completions.
Housing Starts:This was well below expectations of 570 thousand starts in April. I'll have more on starts later ... I expect starts to stay low until more of the excess inventory of existing homes is absorbed.
Privately-owned housing starts in April were at a seasonally adjusted annual rate of 523,000. This is 10.6 percent (±13.0%)* below the revised March estimate of 585 000 and is 23 9 percent (±7 0%) below the revised April 2010 rate of 687 000.
Single-family housing starts in April were at a rate of 394,000; this is 5.1 percent (±10.2%)* below the revised March figure of 415,000. The April rate for units in buildings with five units or more was 114,000.
Building Permits:
Privately-owned housing units authorized by building permits in April were at a seasonally adjusted annual rate of 551,000. This is 4.0 percent (±1.1%) below the revised March rate of 574,000 and is 12.8 percent (±1.2%)below the revised April 2010 estimate of 632,000.
Single-family authorizations in April were at a rate of 385,000; this is 1.8 percent (±1.0%) below the revised March figure of 392,000. Authorizations of units in buildings with five units or more were at a rate of 143,000 in April.


