by Calculated Risk on 6/28/2011 09:00:00 AM
Tuesday, June 28, 2011
Case Shiller: Home Prices increase in April
S&P/Case-Shiller released the monthly Home Price Indices for April (actually a 3 month average of February, March and April).
This includes prices for 20 individual cities and and two composite indices (for 10 cities and 20 cities).
Note: Case-Shiller reports NSA, I use the SA data.
From S&P:April Seasonal Boost in Home Prices
Data through April 2011 ... show a monthly increase in prices for the 10- and 20-City Composites for the first time in eight months. The 10- and 20-City Composites were up 0.8% and 0.7%, respectively, in April versus March. Both indices are lower than a year ago; the 10-City Composite fell 3.1% and the 20-City Composite is down 4.0% from April 2010 levels.
...
Six of the 20 MSAs showed new index lows in April – Charlotte, Chicago, Detroit, Las Vegas, Miami and Tampa. Thirteen of the cities and both composites posted positive monthly changes. With index levels of 152.51 and 138.84, respectively, both the 10- and 20-City Composites are above their March 2011 levels, which had been a new crisis low for the 20-City Composite.
 Click on graph for larger image in graph gallery.
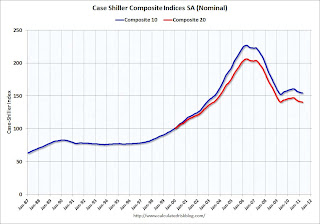
 The first graph shows the nominal seasonally adjusted Composite 10 and Composite 20 indices (the Composite 20 was started in January 2000).
The Composite 10 index is off 31.8% from the peak, and up slightly in April (SA). The Composite 10 is still 1.6% above the May 2009 post-bubble bottom (Seasonally adjusted).
The Composite 20 index is off 31.8% from the peak, and down slightly in April (SA). The Composite 20 is slightly below the May 2009 post-bubble bottom seasonally adjusted.
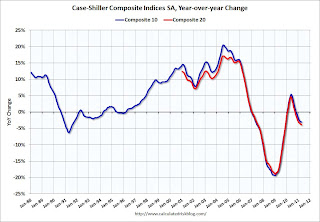
 The second graph shows the Year over year change in both indices.
The Composite 10 SA is down 3.1% compared to April 2010.
The Composite 20 SA is down 3.9% compared to April 2010.
The third graph shows the price declines from the peak for each city included in S&P/Case-Shiller indices.
 Prices increased (SA) in 9 of the 20 Case-Shiller cities in April seasonally adjusted. Prices in Las Vegas are off 58.6% from the peak, and prices in Dallas only off 8.8% from the peak.
From S&P (NSA):
As of April 2011, 19 of the 20 MSAs and both Composites are down compared to April 2010. Washington D.C. continues to be the only market to post a year-over-year gain, at +4.0%. Minneapolis was the only city that demonstrated a double-digit annual decline, -11.1%. While 13 markets rose on a monthly basis, 16 markets saw their annual rates of change fall deeper into negative territory.There could be some confusion between the SA and NSA numbers, but this is some improvement over the last few months.
From their 2006/2007 peaks, six MSAs posted new index level lows in April 2011, a modest improvement over March’s report when 12 MSAs reported new lows. Thirteen of the markets rose in April over March, with six of them increasing by more than 1.0%. Washington DC, once again, stands out with a +3.0% monthly increase and a +4.0% annual growth rate.
With respective index levels of 100.36 and 101.95, Phoenix and Atlanta are two markets that are close to losing any value gained since January 2000. As of April 2011, Cleveland, Detroit and Las Vegas are the three markets where average home prices are lower than where they were 11 years ago.
I'll have more ...


