by Calculated Risk on 6/08/2011 11:32:00 AM
Wednesday, June 08, 2011
CoreLogic House Price Graph, Real Prices, and Prices and Month-of-Supply
Updating some graphs ...
Last week CoreLogic their house price index for April: CoreLogic® Home Price Index Shows First Month-over-Month Increase since mid-2010. The CoreLogic HPI is a three month weighted average of February, March, and April (April weighted the most) and is not seasonally adjusted (NSA).
There was a change in how the data is released, so I didn't include a graph last week - here is the graph.
Note: Case-Shiller is the most followed house price index, but CoreLogic is used by the Federal Reserve and is followed by many analysts.
 Click on graph for larger image in graph gallery.
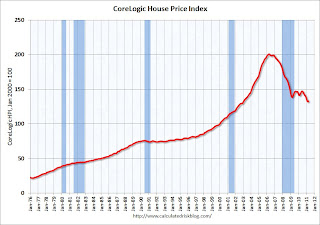
This graph shows the national CoreLogic HPI data since 1976. January 2000 = 100.
The index was up 0.7% in April, and is down 7.5% over the last year, and off 33.8% from the peak.
This is the ninth straight month of year-over-year declines, and the index is now 4.0% below the March 2009 low.
Real House Prices
 The second graph shows the quarterly Case-Shiller National Index SA (through Q1 2011), and the monthly Case-Shiller Composite 20 SA (through March) and CoreLogic House Price Indexes (through April) in real terms (adjusted for inflation using CPI less Shelter). Note: some people use other inflation measures to adjust for real prices.
In real terms, the National index is back to Q4 1999 levels, the Composite 20 index is back to October 2000, and the CoreLogic index is back to January 2000.
House Prices and months-of-supply
Here is a look at house prices and existing home months-of-supply.
 This graph shows existing home months-of-supply (left axis), and the annualized change in the Case-Shiller composite 20 house price index (right axis, inverted).
House prices are through March using the composite 20 index. Months-of-supply is through April. Based on this general relationship, I expect Case Shiller house prices to fall further - although there are some questions about the NAR inventory data.
It now appears that inventory is declining year-over-year (something to watch carefully), but of course sales have been declining too.
Note: there have been periods with high months-of-supply and rising house prices (see: Lawler: Again on Existing Home Months’ Supply: What’s “Normal?” ) so this is just a guide.


