by Calculated Risk on 7/08/2011 02:10:00 PM
Friday, July 08, 2011
More Employment: Return of the Teen! and Unemployment by Duration and Education
First a reminder: The main reason employment growth is sluggish is because the U.S. is recovering from a housing and credit bubble, and the subsequent financial crisis. There is still too much excess capacity in most of the economy for a large contribution from new investment (except in equipment and software). We see this excess capacity in housing, and in overall industrial production. There is also excess capacity in office space, retail space, and other categories of commercial real estate. In addition, household debt, as a percent of income, remains very high and household deleveraging is ongoing. That is why so many companies identify their number one problem as "lack of customers".
Until the excess capacity is absorbed, and household balance sheets are back in order, the recovery will remain sluggish.
In addition there were some (hopefully) temporary factors that impacted employment in May and June: the supply chain disruption and high oil and gasoline prices.
But it is very disappointing to hear politicians incorrectly identify the reasons for the sluggish employment growth. From President Obama today:
[T]o put our economy on a stronger and sounder footing for the future, we’ve got to rein in our deficits and get the government to live within its means, while still making the investments that help put people to work right now and make us more competitive in the future. ...I know there are policymakers who think the problem is confidence and deficits. But this is incorrect. Misdiagnosing the causes of weak employment growth will lead to the wrong policies. Oh well ... this reminds me of 2005 when I couldn't get any policymakers to pay attention to the housing bubble. Frustrating.
The sooner we get this done, the sooner that the markets know that the debt limit ceiling will have been raised and that we have a serious plan to deal with our debt and deficit, the sooner that we give our businesses the certainty that they will need in order to make additional investments to grow and hire and will provide more confidence to the rest of the world as well, so that they are committed to investing in America.
Here are a few more graphs based on the employment report ...
 This graph shows the duration of unemployment as a percent of the civilian labor force. The graph shows the number of unemployed in four categories: less than 5 week, 6 to 14 weeks, 15 to 26 weeks, and 27 weeks or more.
Two key categories are moving up again. The 27 weeks and more (the long term unemployed) has moved up for two consecutive months and is now at 6.3 million workers, or 4.1% of the labor force.
Also the less than 5 weeks category is increasing again and that is very concerning.
 This graph shows the unemployment rate by four levels of education (all groups are 25 years and older).
Unfortunately this data only goes back to 1992 and only includes one previous recession (the stock / tech bust in 2001). Clearly education matters with regards to the unemployment rate - and it appears all four groups are generally trending down, although only High School Graduates, No College" and "Bachelors degree and higher" declined in June.
Although education matters for the unemployment rate, it doesn't appear to matter as far as finding new employment (all four categories are only gradually declining).
 This is a little more technical. The BLS diffusion index for total private employment was at 53.4 in June, about the same as in May, and for manufacturing, the diffusion index increased slightly to 52.5.
 Think of this as a measure of how widespread job gains are across industries. The further from 50 (above or below), the more widespread the job losses or gains reported by the BLS. From the BLS:
Figures are the percent of industries with employment increasing plus one-half of the industries with unchanged employment, where 50 percent indicates an equal balance between industries with increasing and decreasing employment.
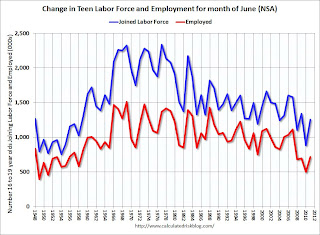
According to the BLS, 714,000 teens (ages 16 to 19) found jobs in June 2011 NSA compared to only 497,000 last year (June is the key months for summer employment). This is the most teen jobs added in June since 2007.
 This graph shows the number of teens looking for work and the number of teens found jobs in June (data is not seasonally adjusted).
The doesn't show the participation rate for teens, but that has been trending down for years.
The job market was so bad last summer few teens even bothered to look for work. Although the trend is still down for teen employment, this is a better summer for teenagers looking for work. A little silver lining ...
Best to all
Here are the earlier employment posts (with graphs):
• June Employment Report: 18,000 Jobs, 9.2% Unemployment Rate
• Employment Summary, Part Time Workers, and Unemployed over 26 Weeks
• Employment graph gallery


