by Calculated Risk on 8/13/2011 02:47:00 PM
Saturday, August 13, 2011
Schedule for Week of August 14th
Earlier: Summary for Week Ending August 12th
Three key housing reports will be released this week: August homebuilder confidence on Monday, July housing starts on Tuesday, and July existing home sales on Thursday.
For manufacturing, the August NY Fed (Empire state) survey will be released on Monday, the August Philly Fed survey on Thursday, and the July Industrial Production and Capacity Utilization report on Tuesday.
On inflation, the July Producer Price index (PPI) will be released Wednesday and CPI will be released Thursday.
8:30 AM ET: NY Fed Empire Manufacturing Survey for August. The consensus is for a reading of 1.0, up slightly from -3.8 in July (above zero is expansion).
10 AM ET: The August NAHB homebuilder survey. The consensus is for a reading of 15, unchanged from July. Any number below 50 indicates that more builders view sales conditions as poor than good. This index has been below 25 for four years.
10:00 AM ET: NY Fed Q2 Report on Household Debt and Credit
 8:30 AM: Housing Starts for July. After collapsing following the housing bubble, housing starts have mostly been moving sideways for over two years.
 Total housing starts were at 629 thousand (SAAR) in June, up 14.6% from the revised May rate of 549 thousand. Single-family starts increased 9.4% to 453 thousand in June.
The consensus is for a decrease to 600,000 (SAAR) in July.
8:30 AM: Import and Export Prices for July. The consensus is a for a 0.1% decrease in import prices.
 9:15 AM ET: The Fed will release Industrial Production and Capacity Utilization for July.
 This graph shows industrial production since 1967. Industrial production increased in June to 93.1.
The consensus is for a 0.5% increase in Industrial Production in July, and an increase to 77.0% (from 76.7%) for Capacity Utilization. The Ceridian index suggests Industrial Production was flat in July.
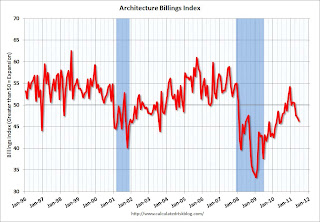
 Early: The AIA's Architecture Billings Index for July (a leading indicator for commercial real estate).
This graph shows the Architecture Billings Index since 1996. The index decreased in June to 46.3 from 47.2 in May. Anything below 50 indicates a contraction in demand for architects' services.
This index usually leads investment in non-residential structures (hotels, malls, office) by 9 to 12 months.
7:00 AM: The Mortgage Bankers Association (MBA) will release the mortgage purchase applications index. This index has been very weak over the last several months, although refinance activity has picked up recently.
8:30 AM: Producer Price Index for July. The consensus is for no change in producer prices (0.2% increase in core).
8:30 AM: The initial weekly unemployment claims report will be released. The consensus is for an increase to 400,000 from 395,000 last week.
8:30 AM: Consumer Price Index for July. The consensus is for a 0.2% increase in prices. The consensus for core CPI is an increase of 0.2%.
10:00 AM: Philly Fed Survey for August. The consensus is for a reading of 4.0 (above zero indicates expansion), up from 3.2 last month.
 10:00 AM: Existing Home Sales for July from the National Association of Realtors (NAR). The consensus is for sales of 4.92 million at a Seasonally Adjusted Annual Rate (SAAR) in July, up from 4.77 million SAAR in June.
Note: the NAR is working on benchmarking existing home sales for previous years with other industry data (expectations are for large downward revisions). These revisions are expected this fall.
10:00 AM: Conference Board Leading Indicators for July. The consensus is for a 0.2% increase for this index.
10:00 AM: Regional and State Employment and Unemployment (Monthly) for July 2011


