by Calculated Risk on 9/09/2011 11:17:00 AM
Friday, September 09, 2011
Hotels: Occupancy Rate increases 6.6% compared to same week in 2010
Note: This is one of the industry specific measures that I follow. I only post this every few weeks or so.
From HotelNewsNow.com: STR: US results for week ending 3 September
In year-over-year comparisons for the week, occupancy rose 6.6 percent to 61.1 percent, average daily rate increased 4.8 percent to US$99.04, and revenue per available room finished the week up 11.6 percent to US$60.53.Note: ADR: Average Daily Rate, RevPAR: Revenue per Available Room.
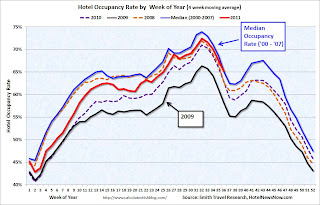
The following graph shows the seasonal pattern for the hotel occupancy rate using a four week average for the occupancy rate.
 Click on graph for larger image in graph gallery.
The summer leisure travel season has ended, and the 4-week average of the occupancy rate is starting to decrease seasonally. For the first time since early 2008, the 4 week average of the hotel occupancy rate is back to the pre-recession median level.
Even though the occupancy rate has recovered, ADR is still lower than before the recession.
 The second graph shows the 4-week average of the occupancy rate as a percent of the median since 2000. Note: Since this is a percent of the median, the number can be above 100%.
This shows the decline in the occupancy rate during and following the 2001 recession. The sharp decline in 2001 was related to 9/11, and the sharp increase towards the end of 2005 was due to Hurricane Katrina.
The occupancy rate really fell off a cliff in 2008, and has slowly recovered back to the median.
Data Source: Smith Travel Research, Courtesy of HotelNewsNow.com


