by Calculated Risk on 9/04/2011 06:47:00 PM
Sunday, September 04, 2011
Weekly Schedule and Graph Galleries
By request, I've added links for the Weekly Schedule of economic releases and the graph galleries at the bottom of the first post.
The graph galleries are a collection of the most recent versions of frequently updated graphs. (Older versions are removed).
The Graph Galleries are grouped by Employment, New Home Sales, Existing Home sales and much more. There are tabs for each gallery. Clicking on a tab will load a gallery. Then thumbnails will appear below the main graph for all of the graphs in the selected gallery. Clicking on the thumbnails will display each graph.
To access the galleries, just click on a graph on the blog - or click on "Graph Galleries" at the bottom of the first post.
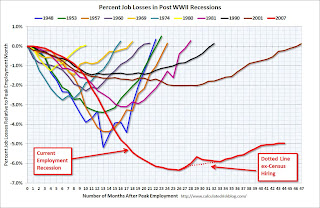
 As an example, clicking on this graph (based on the most recent employment report), will open the "employment" chart gallery and display this graph - with thumbnails for other employment related graphs.
The "print" key displays the full size image of the selected graph for printing from your browser.
The title below the graph is a link to the post on Calculated Risk and also includes the date the graph was posted to the gallery.
Note: The graphs are free to use on websites or for presentations. All I ask is that online sites link to my site http://www.calculatedriskblog.com/ and that printed presentations credit www.calculatedriskblog.com.
Best to all.
Yesterday:
• Summary for Week ending September 2nd (with plenty of graphs)
Friday on employment:
• August Employment Report: 0 Jobs (unchanged), 9.1% Unemployment Rate
• Employment Summary, Part Time Workers, and Unemployed over 26 Weeks
• Duration of Unemployment, Unemployment by Education and Diffusion Indexes


