by Calculated Risk on 10/11/2011 06:50:00 PM
Tuesday, October 11, 2011
Distressed House Sales using Sacramento Data
I've been following the Sacramento market to see the change in mix over time (conventional, REOs, and short sales) in a distressed area. The Sacramento Association of REALTORS® started breaking out REOs in May 2008, and short sales in June 2009.
As I've written before: "I'm not sure what I'm looking for, but I'll know it when I see it!" (hopefully) At some point, the number (and percent) of distressed sales should start to decline without market distortions.
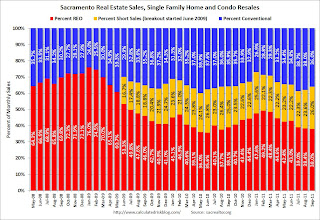
The percent of distressed sales in Sacramento increased in September compared to August. In September 2011, 64.0% of all resales (single family homes and condos) were distressed sales. This is up from 62.0% in August, and down slightly from 64.1% in September 2010.
Here are the statistics.
 Click on graph for larger image in graph gallery.
This graph shows the percent of REO, short sales and conventional sales. There is a seasonal pattern for conventional sales (strong in the spring and summer), and distressed sales happen all year - so the percentage of distressed sales decreases every summer and the increases in the fall and winter.
Total sales were up 12.9% over September 2010. Sales were up slightly compared to September 2009.
Active Listing Inventory is down 30% from last September, although "short sale contingent" has increased. Still, we are seeing a sharp decline in inventory in many areas, and that is something to watch. Once the foreclosure delays end, this data might be helpful in determining when the market is improving.
So far - no improvement!


