by Calculated Risk on 10/13/2011 02:31:00 PM
Thursday, October 13, 2011
Hotels: Occupancy Rate shows slight year-over-year increase
Note: This is one of the industry specific measures that I follow.
From HotelNewsNow.com: STR: US hotels report slight performance gains
In year-over-year comparisons for the week, occupancy rose 1.5% to 64.4%, average daily rate increased 2.8% to US$104.48, and revenue per available room finished the week up 4.3% to US$67.32.Note: ADR: Average Daily Rate, RevPAR: Revenue per Available Room.
The slowdown in performance is attributable, in part, to Yom Kippur, the Jewish holiday which fell on 8 October this year. In 2010 the holiday was on 18 September.
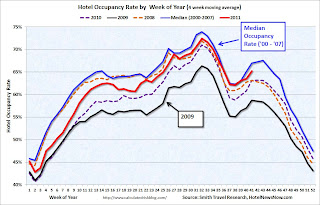
The following graph shows the seasonal pattern for the hotel occupancy rate using a four week average for the occupancy rate.
 Click on graph for larger image in graph gallery.
We are now in the fall business travel season. The 4-week average of the occupancy rate will increase again seasonally. In September, the 4-week average was back to the pre-recession median, but so far the fall business travel season has been weaker than the median - but better than last year.
Even though the occupancy rate has mostly recovered, ADR and RevPAR are still lower than before the recession for the comparable week.
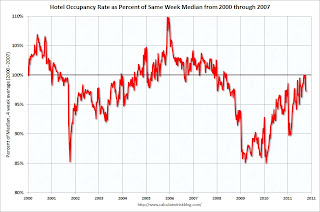
 The second graph shows the 4-week average of the occupancy rate as a percent of the median since 2000. Note: Since this is a percent of the median, the number can be above 100%.
This shows the decline in the occupancy rate during and following the 2001 recession. The sharp decline in 2001 was related to 9/11, and the sharp increase towards the end of 2005 was due to Hurricane Katrina.
The occupancy rate really fell off a cliff in 2008, and has slowly recovered back close to the median. This measure has declined over the last couple of weeks.
Data Source: Smith Travel Research, Courtesy of HotelNewsNow.com


