by Calculated Risk on 10/03/2011 06:56:00 PM
Monday, October 03, 2011
LPS: Foreclosure Starts increased in August, Seriously Delinquent Mortgage Loans fall to 2008 levels
From LPS Applied Analytics: LPS' Mortgage Monitor Report Shows Foreclosure Starts Rose Nearly 20 Percent in August, But Down More Than 12 Percent From Same Time Last Year
The August Mortgage Monitor report released by Lender Processing Services, Inc. shows that foreclosure starts were up in August by nearly 20 percent compared to July 2011 results, with first-time foreclosure starts reaching 2011 highs. Overall, foreclosure starts remained down more than 12 percent from this time last year. At the same time, of the approximately 4 million loans that are either 90 or more days delinquent or in foreclosure, the number in the 90 or more days category has shrunk to levels not seen since 2008.According to LPS, 8.13% of mortgages were delinquent in August, down from 8.34% in July, and down from 9.22% in August 2010.
The August data also showed that, of loans that were current six months prior, 1.4 percent had become seriously delinquent, a rate of less than half of the peak of 2.9 percent in 2009. ...
August results showed an all-time high in the number of loans shifting from foreclosure back into delinquent status, suggesting that process reviews and potential loss mitigation activity are continuing. As a result, foreclosure timelines continue to increase, with the average loan in foreclosure having been delinquent for a record 611 days.
LPS reports that 4.11% of mortgages were in the foreclosure process, unchanged from July, and up from 3.8% in August 2010. This gives a total of 12.24% delinquent or in foreclosure. It breaks down as:
• 2.38 million loans less than 90 days delinquent.
• 1.87 million loans 90+ days delinquent.
• 2.15 million loans in foreclosure process.
For a total of 6.40 million loans delinquent or in foreclosure in August.
 Click on graph for larger image in graph gallery.
This graph shows the total delinquent and in-foreclosure rates since 1995.
The total delinquent rate has fallen to 8.13% from the peak in January 2010 of 10.97%. A normal rate is probably in the 4% to 5% range, so there is a long long ways to go.
However the in-foreclosure rate at 4.11% is barely below the peak rate of 4.21% in March 2011. There are still a large number of loans in this category (about 2.15 million) - and the average loan in foreclosure has been delinquent for a record 611 days!
 This graph provided by LPS Applied Analytics shows the number of loans 90 days delinquent by duration of delinquency.
The total number of loans 90+ delinquent is back to 2008 levels, but about 42% of these loans have been delinquent for more than 12 months and are still not in foreclosure. That is close to 800,000 loans.
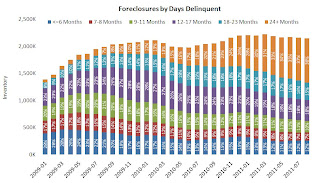
 The third graph shows the number of loans in foreclosure by duration of delinquency.
There are 2.15 million loans in the foreclosure process and about 38% have been delinquent for more than 2 years, and another 33% have been delinquent for 1 to 2 years. Many of these loans are still in process review.
There was some good news: cure rates are increasing for all categories, “first-time” delinquencies have declined, and the number of seriously delinquent loans is back to 2008 levels. However there are still 2.15 million loans in the foreclosure process and another 1.87 million 90+ days delinquent.
Earlier:
• ISM Manufacturing index increases in September
• Construction Spending increased in August
• U.S. Light Vehicle Sales at 13.1 million SAAR in September


