by Calculated Risk on 10/22/2011 08:11:00 AM
Saturday, October 22, 2011
Summary for Week ending Oct 21st
The European financial crisis is front page news every day now. The next installment of Greek aid has been approved by the EU finance ministers, and there is a summit meeting on Sunday of EU leaders. Although there will be announcements on Sunday, there will also be a 2nd summit meeting later in the week to approve the details. More to come tomorrow!
In the U.S. there has been more discussion of further Fed action. As an example, see Fed Is Poised for More Easing and Fed Official Hints at Possible Effort to Boost Economy. There will be another key speech on Monday by NY Fed president William Dudley.
The U.S. economic data was generally better than the very low expectations. The NY Fed manufacturing survey was weak, but the Philly Fed survey was better than expected and showed expansion in October. The 4-week average of initial weekly unemployment claims fell to the lowest level since early April.
Housing starts increased in September, mostly due to an increase in multi-family starts. And the remodeling index showed a strong increase.
It now appears Q3 GDP will be around 2.5%, still weak – but better than expected just a few weeks ago.
Here is a summary in graphs:
• Housing Starts increased in September
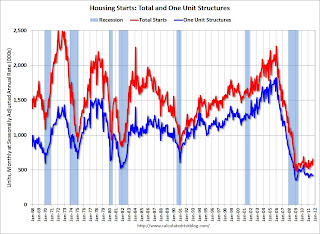
 Total housing starts were at 658 thousand (SAAR) in September, up 15.0% from the revised August rate of 572 thousand. Most of the increase was for multi-family starts.
Single-family starts increased 1.7% to 425 thousand in September.
Multi-family starts are increasing in 2011 - although from a very low level. This was well above expectations of 590 thousand starts in September.
Single family starts are still "moving sideways".
• Existing Home Sales in September: 4.91 million SAAR, 8.5 months of supply
 This graph shows existing home sales, on a Seasonally Adjusted Annual Rate (SAAR) basis since 1993.
Sales in September 2011 (4.91 million SAAR) were 3.0% lower than last month, and were 11.3% above the September 2010 rate.
According to the NAR, inventory decreased to 3.48 million in September from 3.55 million in August.
 The next graph shows the year-over-year (YoY) change in reported existing home inventory and months-of-supply. Since inventory is not seasonally adjusted, so it really helps to look at the YoY change. Note: Months-of-supply is based on the seasonally adjusted sales and not seasonally adjusted inventory.
Inventory decreased 13.0% year-over-year in September from September 2010. This is the eight consecutive month with a YoY decrease in inventory. Months of supply increased to 8.5 months in September, up from 8.4 months in August.
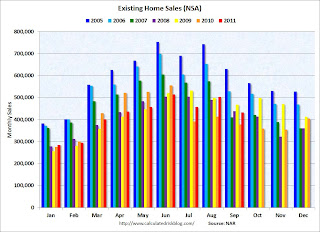
 The following graph shows existing home sales Not Seasonally Adjusted (NSA). The red columns are for 2011.
Sales NSA are above last September - of course sales declined sharply last year following the expiration of the tax credit in June 2010. The level of sales is still elevated due to investor buying. The NAR noted: "All-cash sales accounted for 30 percent of purchase activity in September, up from 29 percent in August and 29 percent also in September 2010; investors make up the bulk of cash purchases."
• Industrial Production increased 0.2% in September, Capacity Utilization increased slightly
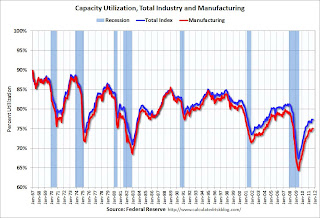
 From the Fed: Industrial production and Capacity Utilization "Industrial production increased 0.2 percent in September after having been unchanged in August. ... Capacity utilization for total industry edged up to 77.4 percent ..."
This graph shows Capacity Utilization. This series is up 10.1 percentage points from the record low set in June 2009 (the series starts in 1967).
Capacity utilization at 77.4% is still 3.0 percentage points below its average from 1972 to 2010 and below the pre-recession levels of 81.3% in December 2007.
 This graph shows industrial production since 1967.
Industrial production increased in September to 94.2. July was revised up, so there was no increase in August.
After the fairly rapid increase last year, increases in industrial production and capacity utilization have slowed recently.
The consensus was for a 0.2% increase in Industrial Production in September, and an increase to 77.5% for Capacity Utilization.
• AIA: Architecture Billings Index declined in September
 Note: This index is a leading indicator for new Commercial Real Estate (CRE) investment.
From AIA: Another Drop for Architecture Billings Index
"The American Institute of Architects (AIA) reported the September ABI score was 46.9, following a score of 51.4 in August."
This graph shows the Architecture Billings Index since 1996. Anything below 50 indicates contraction in demand for architects' services.
Note: This includes commercial and industrial facilities like hotels and office buildings, multi-family residential, as well as schools, hospitals and other institutions.
According to the AIA, there is an "approximate nine to twelve month lag time between architecture billings and construction spending" on non-residential construction. So the recent contraction suggests further declines in CRE investment in 2012.
• Rate of increase slows for Key Measures of Inflation in September
 The Cleveland Fed released the median CPI and the trimmed-mean CPI: "According to the Federal Reserve Bank of Cleveland, the median Consumer Price Index rose 0.2% (2.3% annualized rate) in September. The 16% trimmed-mean Consumer Price Index increased 0.2% (2.5% annualized rate) during the month.
Over the last 12 months, the median CPI rose 2.1%, the trimmed-mean CPI rose 2.5%, the CPI rose 3.9%, and the CPI less food and energy rose 2.0%"
On a year-over-year basis, these measures of inflation are increasing, and are around the Fed's target.
On a monthly basis, the median Consumer Price Index increased 2.3% at an annualized rate, the 16% trimmed-mean Consumer Price Index increased 2.5% annualized in July, and core CPI increased 0.7% annualized.
These key price measures increased at a lower rate than in August.
• Empire State and Philly Fed Manufacturing Surveys
The Fed surveys were mixed.
 From the NY Fed: Empire State Manufacturing Survey "The Empire State Manufacturing Survey indicates that conditions for New York manufacturers continued to deteriorate in October. The general business conditions index remained negative and, at -8.5, was little changed."
From the Philly Fed: October 2011 Business Outlook Survey "The survey’s broadest measure of manufacturing conditions, the diffusion index of current activity, increased from ‐17.5 in September to 8.7, the first positive reading in three months."
The graph above compares the regional Fed surveys and the ISM manufacturing index. The dashed green line is an average of the NY Fed (Empire State) and Philly Fed surveys through October. The ISM and total Fed surveys are through September.
The average of the Empire State and Philly Fed surveys rebounded in October, and is now slightly positive.
• Weekly Initial Unemployment Claims: 4-Week average lowest since April
The following graph shows the 4-week moving average of weekly claims since January 2000 (there is a longer term graph in graph gallery).
 The dashed line on the graph is the current 4-week average. The four-week average of weekly unemployment claims declined this week to 403,000.
This is the lowest level for the 4-week average of weekly claims since April, and this was slightly above the consensus forecast. This is still elevated, and still above the post-recession lows of earlier this year.
• Other Economic Stories ...
• Residential Remodeling Index at new high in August
• NAHB Builder Confidence index increases in October
• From Fed Chairman Ben Bernanke: Effects of the Great Recession on Central Bank Doctrine and Practice
• 2012 Social Security Cost-Of-Living Adjustment approximately 3.6% increase
• LA Port Traffic in September: Exports increase year-over-year, Imports Down
• State Unemployment Rates "little changed" in September


