by Calculated Risk on 11/15/2011 04:04:00 PM
Tuesday, November 15, 2011
Lawler on FHA MMIF Actuarial Review for FY 2011
From economist Tom Lawler: HUD released the annual Actuarial Review of the FHA’s Mutual Mortgage Insurance Fund for FY 2011, which is required by law and which is performed by an independent entity (lately IFE Group) to assess the “economic net worth” and “financial soundness” of the fund. According to the latest review, the estimated “economic net worth” of the MMIF (ex HECMs) at the end of FY 2011 (9/30/11) – defined as the sum of existing capital resources plus the net present value of the current books of business (using “base-case” economic scenarios) – was just $1.19 billion, down from $5.16 billion at the end of FY 2010. The “base case” scenario for home prices is based on Moody’s July 2011 forecast for the FHFA home price index, which I guess IFE Group uses because the FHFA HPIs cover a large number of MSAs, even though these HPIs are widely viewed as not being the “best” measures of home price trends. This forecast shows home price declining modestly next year.
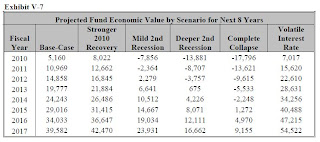
Last year, the actuarial review estimated that by the end of FY 2011 the MMIF’s “economic value” would rise to $10.969 billion, as opposed to the latest report’s decline to $1.1193 billion. The FHFA “national” HPI fell in 2010 and early 2011 by more than was projected in the “base-case” used for the FY2010 actuarial review. However, Moody’s forecast for home price appreciation is a bit above last July’s, and as a result the “base-case” economic assumptions actually were a PLUS to IFE’s estimate of the FY 2011 “economic value.”
The major “negative hit” to the MMIF EV was related to “updated econometric model and portfolio status” factors, especially (1) much slower prepayment forecasts, and (2) the elimination of last year’s questionable “policy year dummy variables.” In addition, there was a negative “adjustment for foreclosure loans,” reflecting the unusually large number of loans in the foreclosure process at the time of the review, including a larger-than-normal number of properties where foreclosures had apparently been completed but servicers had not yet filed claims.

CR Note: here are the house price scenarios used in the analysis.
As with last year, this year’s review included some “sensitivity analysis,” which suggested that the MMIF’s exposure to “bad” scenarios had worsened from last year. [Below] are tables showing the estimated “economic value” of the MMIF under alternative scenarios from the FY 2010 Actuarial Review, and from the FY 2011 Actuarial Review.

And the second table is from the 2011 review. As Tom Lawler notes, the FHA has performed worse than the base case for 2010 - and there are much bigger expected losses under the “Worse-than-Base-Case” scenarios.

Folks who want to read the whole thing can find it here.


