by Calculated Risk on 11/19/2011 08:05:00 AM
Saturday, November 19, 2011
Summary for Week Ending Nov 18th
Another week, same lead sentence: The drama in Europe continues to overshadow the U.S. economic situation and the European financial crisis continues to pose the greatest downside risk to the U.S. economy. That said ...
In the U.S., the economic data continues to show improvement. The four week average of initial weekly unemployment claims fell below 400,000 for the first time since April. Retail sales were solid in October. Housing starts declined slightly – due to the volatile multi-family starts segment – but were well above expectations.
For manufacturing, industrial production and capacity utilization continued to increase, and both the NY Fed and Philly Fed surveys showed some expansion (the first time both showed expansion since May).
Mortgage delinquencies declined in Q3 (slowly), and inflation moderated in October. All positive news for the economy and the news flow led to several Q4 upgrades, from Bloomberg: “Economists at JPMorgan Chase & Co. (JPM) in New York now see gross domestic product rising 3 percent in the final quarter, up from a previous prediction of 2.5 percent. Macroeconomic Advisers in St. Louis increased its forecast to 3.2 percent from 2.9 percent at the start of November, while New York-based Morgan Stanley & Co. boosted its outlook to 3.5 percent from 3 percent.” Also Merrill Lynch has increased their Q4 forecast to 3.0%.
Here is a summary in graphs:
• Housing Starts declined slightly in October
 Click on graph for larger image.
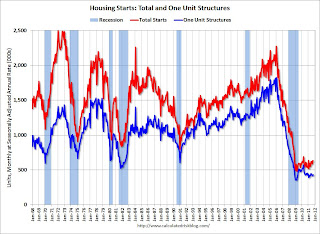
Total housing starts were at 628 thousand (SAAR) in October, down 0.3% from the revised September rate of 630 thousand (SAAR). Most of the increase this year has been for multi-family starts.
Single-family starts increased 3.9% to 430 thousand in October.
Multi-family starts are increasing in 2011 - although from a very low level. This was well above expectations of 605 thousand starts in October.
Single family starts are still "moving sideways".
• Retail Sales increased 0.5% in October
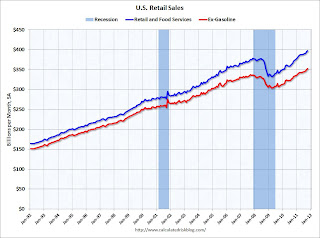 On a monthly basis, retail sales were up 0.5% from September to October (seasonally adjusted, after revisions), and sales were up 7.9% from October 2010. Retail sales excluding autos increased 0.6% in October. Sales for September were unrevised with a 1.1% increase.
This graph shows retail sales since 1992. This is monthly retail sales and food service, seasonally adjusted (total and ex-gasoline).
Retail sales are up 19.5% from the bottom, and now 5.1% above the pre-recession peak (not inflation adjusted)
This was well above the consensus forecast for retail sales of a 0.2% increase in October, and no change ex-auto. This was a solid report, especially following the very strong September report.
• Industrial Production increased 0.7% in October, Capacity Utilization increased
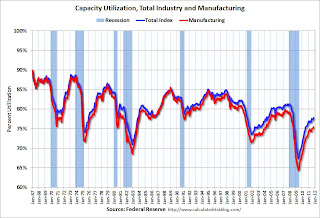 "Industrial production expanded 0.7 percent in October after having declined 0.1 percent in September. Previously, industrial production was reported to have gained 0.2 percent in September ... Capacity utilization for total industry stepped up to 77.8 percentThis graph shows Capacity Utilization."
Capacity utilization at 77.8% is still 2.6 percentage points below its average from 1972 to 2010 and below the pre-recession levels of 81.3% in December 2007.
 The second graph shows industrial production since 1967.
Industrial production increased in October to 94.7, however September was revised down.
The consensus was for a 0.4% increase in Industrial Production in October, and an increase to 77.6% for Capacity Utilization. Adjusting for the downward revision for September, this was about at consensus.
• MBA: Mortgage Delinquencies decline slightly in Q3
 The MBA reported that 12.42 percent of mortgage loans were either one payment delinquent or in the foreclosure process in Q3 2011 (delinquencies seasonally adjusted). This is down slightly from 12.87 percent in Q2 2011.
 This graph shows the percent of loans delinquent by days past due.
Loans 30 days delinquent decreased to 3.19% from 3.46% in Q2. This is the lowest level since early 2007. Delinquent loans in the 60 day bucket decreased slightly to 1.30% from 1.37% last quarter. This is the lowest level since Q1 2008. There was a decrease in the 90+ day delinquent bucket too. This decreased to 3.50% from 3.61% in Q2 2011. This is the lowest level since 2008. This decrease was probably due to the pickup in foreclosure actions.
The percent of loans in the foreclosure process was unchanged at 4.43%.
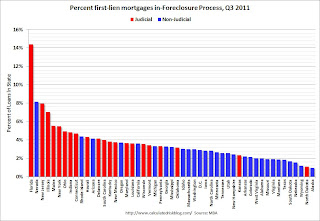 This graph shows the percent of loans in the foreclosure process by state and by foreclosure process. Red is for states with a judicial foreclosure process. Because the judicial process is longer, those states typically have a higher percentage of loans in the process. Nevada is an exception.
Florida, Nevada, New Jersey, Illinois and New York are the top five states with percent of loans in the foreclosure process. In Arizona and California, the percent of loans in the foreclosure process is declining fairly rapidly.
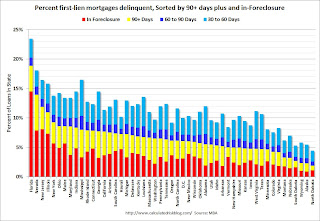 This graph shows all delinquent loans by state (sorted by percent seriously delinquent).
Florida and Nevada have the highest percentage of serious delinquent loans, followed by New Jersey, Illinois, and New York.
So the delinquency rate improved in each bucket (30+, 60+, 90+ days), but the percent of loans in the foreclosure process was unchanged. The key problem remains the very high level of seriously delinquent loans and loans in the foreclosure process.
• AIA: Architecture Billings Index increased in October
 This graph shows the Architecture Billings Index since 1996. The index increased to 49.4 in October from 46.9 in September. Anything below 50 indicates contraction in demand for architects' services.
Note: This includes commercial and industrial facilities like hotels and office buildings, multi-family residential, as well as schools, hospitals and other institutions.
According to the AIA, there is an "approximate nine to twelve month lag time between architecture billings and construction spending" on non-residential construction. So the recent surveys suggests further declines in CRE investment in 2012.
• Regional Fed Manufacturing Surveys: Empire and Philly
From the Philly Fed: Regional manufacturing is expanding, but at a slow pace
From the NY Fed: Conditions for New York manufacturers held steady in November.
 Here is a graph comparing the regional Fed surveys and the ISM manufacturing index. The dashed green line is an average of the NY Fed (Empire State) and Philly Fed surveys through November. The ISM and total Fed surveys are through October.
The average of the Empire State and Philly Fed surveys increased again in November, and is has been slightly positive for two months.
• Rate of increase slows for Key Measures of Inflation in October
 "According to the Federal Reserve Bank of Cleveland, the median Consumer Price Index rose 0.2% (2.3% annualized rate) in October. The 16% trimmed-mean Consumer Price Index increased 0.1% (1.4% annualized rate) during the month.
 ...
The CPI less food and energy increased 0.1% (1.6% annualized rate) on a seasonally adjusted basis. ... Over the last 12 months, the median CPI rose 2.2%, the trimmed-mean CPI rose 2.5%, the CPI rose 3.5%, and the CPI less food and energy rose 2.1%."
On a year-over-year basis, these measures of inflation are increasing, and are slightly above the Fed's target. However, on a monthly basis, the rate of increase is mostly below the Fed's target. On a monthly basis, the median Consumer Price Index increased 2.3% at an annualized rate, the 16% trimmed-mean Consumer Price Index increased 1.4% annualized, and core CPI increased 1.6% annualized.
These key price measures increased at a lower rate than in September.
• Weekly Initial Unemployment Claims: Four Week average falls under 400,000
 "In the week ending November 12, the advance figure for seasonally adjusted initial claims was 388,000, a decrease of 5,000 from the previous week's revised figure of 393,000. The 4-week moving average was 396,750, a decrease of 4,000 from the previous week's revised average of 400,750."
The following graph shows the 4-week moving average of weekly claims since January 2000.
The dashed line on the graph is the current 4-week average. The four-week average of weekly unemployment claims decreased this week to 396,750. This is the lowest level for the 4 week average since early April - although this is still elevated.
• Residential Remodeling Index at new high in September
 The BuildFax Residential Remodeling Index was at 141.4 in September, up from 138.6 in August. This is based on the number of properties pulling residential construction permits in a given month.
 This is the highest level for the index (started in 2004) - even above the levels from 2004 through 2006 during the home equity ("home ATM") withdrawal boom.
Note: Permits are not adjusted by value, so this doesn't mean there is more money being spent, just more permit activity. Also some smaller remodeling projects are done without permits and the index will miss that activity.
Even though new home construction is still moving sideways, two other components of residential investment will increase in 2011: multi-family construction and home improvement.
• Other Economic Stories ...
• LPS: House Price Index Shows 3.8 Percent Year-Over-Year Decline in August
• NAHB Builder Confidence index increases in November


