by Calculated Risk on 11/05/2011 08:13:00 AM
Saturday, November 05, 2011
Summary for Week Ending Nov 4th
The drama in Europe continues to overshadow the U.S. economic situation. Greece was the main topic this week, but Italy is a greater concern. I'll post some updates on Sunday.
The October employment report was the key economic story in the U.S. last week. There were only 80,000 jobs added in October. This included 104,000 private sector jobs added, and 24,000 government jobs lost. However the change in total employment was revised up for August and September. "The change in total nonfarm payroll employment for August was revised from +57,000 to +104,000, and the change for September was revised from +103,000 to +158,000."
Still sluggish employment growth.
The household survey showed an increase of 277,000 jobs in October. This increase in the household survey pushed the unemployment rate down slightly, even as more people participated in the workforce (labor force increased by 181,000). The unemployment rate declined to 9.0%, and the participation rate was unchanged at 64.2%. The employment population ratio also increased to 58.4% from 58.3%. This is the third straight monthly increase in the employment population ratio from the low in July at 58.1%.
Through the first ten months of 2011, the economy has added 1.256 million total non-farm jobs or just 125 thousand per month. This is a better pace of payroll job creation than last year, but the economy still has 6.47 million fewer payroll jobs than at the beginning of the 2007 recession.
At this pace (125 thousand jobs added per month) it will take over 4 years just to get back to the number of jobs in 2007 - and that doesn't account for population growth.
The economy has added 1.529 million private sector jobs this year, or about 153 thousand per month. There are a total of 13.9 million Americans unemployed and 5.9 million have been unemployed for more than 6 months. Overall this was another weak employment report and suggests sluggish economic growth.
The FOMC met this week with no policy changes. After the FOMC statement was released, Fed Chairman Ben Bernanke held a press briefing (video here, transcript here). Perhaps the key comment was:
"[T]he outlook remains unsatisfactory over the next few years and we'll continue to ask ourselves whether or not additional stimulus or additional actions can provide a better outcome and that's certainly something that is--remains on the table and we'll continue to evaluate as we go forward."That suggests that the Fed will act if the outlook doesn't improve soon as compared to their current forecast. Their current forecast is already pretty dismal - clearly "unsatisfactory".
Also Bernanke almost pleaded for a little fiscal help from Congress:
"I think it would be helpful if we could get assistance from some other parts of the government to work with us to help create more jobs."The U.S. economic data was mostly soft - suggesting sluggish growth. The ISM Manufacturing and service indexes indicated slower expansion in October. The Chicago PMI declined in October, the Dallas Fed manufacturing survey showed sluggish expansion, and the restaurant performance index was barely positive.
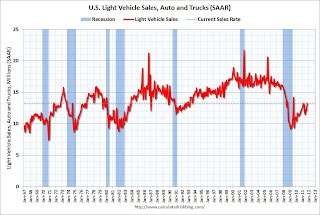
One bright spot was auto sales in October. According to an advance estimate for Autodata Corp, light vehicle sales were at a 13.26 million SAAR in October. That is the highest level this year (barely above the 13.24 million SAAR in February).
Sluggish growth continues.
Here is a summary in graphs:
• October Employment Report: 80,000 Jobs, 9.0% Unemployment Rate
 Click on graph for larger image.
The BLS reported:
Nonfarm payroll employment continued to trend up in October (+80,000), and the unemployment rate was little changed at 9.0 percent, the U.S. Bureau of Labor Statistics reported today.This graph shows the job losses from the start of the employment recession, in percentage terms. The dotted line is ex-Census hiring. The red line is moving slowly upwards.
 This graph shows the employment population ratio, the participation rate, and the unemployment rate.
The unemployment rate declined to 9.0% (red line). The Labor Force Participation Rate was unchanged 64.2% in October (blue line). This is the percentage of the working age population in the labor force. The participation rate is well below the 66% to 67% rate that was normal over the last 20 years, although some of the decline is due to the aging population.
 The Employment-Population ratio increased to 58.4% in October (black line).
The third employment graph is the same as the first, except this graph is aligned at maximum job losses.
In terms of lost payroll jobs, the 2007 recession was by far the worst since WWII.
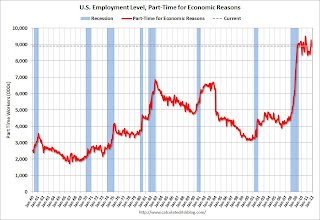
Part Time for Economic Reasons. From the BLS report:

The number of persons employed part time for economic reasons (sometimes referred to as involuntary part-time workers) decreased by 374,000 to 8.9 million in October.The number of workers only able to find part time jobs (or have had their hours cut for economic reasons) decreased to 8.896 million in October from 9.27 million in September. This just reverses some of the increase last month.
These workers are included in the alternate measure of labor underutilization (U-6) that decreased to 16.2% in October from 16.5% in September.
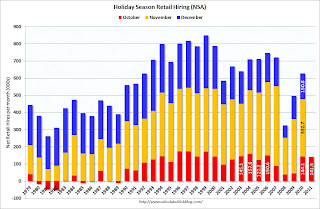
 According to the BLS employment report, retailers hired seasonal workers at close to the pre-crisis pace in October.
Typically retail companies start hiring for the holiday season in October, and really increase hiring in November. This graph that shows the historical net retail jobs added for October, November and December by year.
Retailers hired 141.5 thousand workers (NSA) net in October. This is about the same level as in 2003 through 2006 and the same as in 2010. Note: this is NSA (Not Seasonally Adjusted). This suggests retailers are somewhat optimistic about the holiday season.
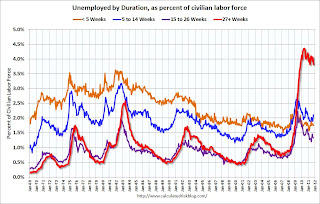
 This graph shows the duration of unemployment as a percent of the civilian labor force. The graph shows the number of unemployed in four categories: less than 5 week, 6 to 14 weeks, 15 to 26 weeks, and 27 weeks or more.
Only one category increased in October: The 6 to 14 weeks. This is due to the increase in short term unemployment in August and September. A little bit of recent good news is that short term unemployment (less than 5 weeks) has declined.
The the long term unemployed declined to 3.8% of the labor force - the number (and percent) of long term unemployed remains very high.
• U.S. Light Vehicle Sales at 13.26 million SAAR in October, Highest since Aug 2009
 Based on an estimate from Autodata Corp, light vehicle sales were at a 13.26 million SAAR in October. That is up 9.2% from October 2010, and up 1.7% from the sales rate last month (13.04 million SAAR in Sept 2011). This was just above the February sales and the highest sales rate since August 2009 ("Cash-for-clunkers")
 This was slightly above the consensus forecast of 13.2 million SAAR.
Growth in auto sales should make a positive contribution to Q4 GDP. Sales in Q3 averaged 12.45 million SAAR, and if November and December are at the October rate, sales will be up 6.5% in Q4 over Q3.
• ISM Manufacturing index indicates slower expansion in October
 PMI was at 50.8%% in October, down from 51.6% in September. The employment index was at 53.5%, down from 53.8%, and new orders index was at 52.4%, up from 49.6%.
 From the Institute for Supply Management: October 2011 Manufacturing ISM Report On Business®
Here is a long term graph of the ISM manufacturing index.
This was below expectations of 52.0%, and suggests manufacturing expanded at a slightly slower rate in October than in September.
• LPS: Foreclosure timelines increase, Mortgage delinquency rate declines slightly in September
From LPS Applied Analytics: LPS' Mortgage Monitor Report Shows Significant Difference in Inventories, Timelines Between Judicial and Non-Judicial States
According to LPS, 8.09% of mortgages were delinquent in September, down from 8.13% in August, and down from 9.27% in September 2010.
 LPS reports that 4.18% of mortgages were in the foreclosure process, up from 4.11% in August, and up from 3.84% in September 2010. This gives a total of 12.27% delinquent or in foreclosure. It breaks down as:
• 2.36 million loans less than 90 days delinquent.
• 1.84 million loans 90+ days delinquent.
• 2.17 million loans in foreclosure process.
For a total of 6.37 million loans delinquent or in foreclosure in September.
The total delinquent rate has fallen to 8.09% from the peak in January 2010 of 10.97%. A normal rate is probably in the 4% to 5% range, so there is a long long ways to go.
However the in-foreclosure rate at 4.18% is barely below the peak rate of 4.21% in March 2011. There are still a large number of loans in this category (about 2.17 million) - and, for judicial states, the average loan in foreclosure has been delinquent for 761 days (six months less for non-judicial states).
• Construction Spending increased slightly in September
The Census Bureau reported that overall construction spending increased in September:
The U.S. Census Bureau of the Department of Commerce announced today that construction spending during September 2011 was estimated at a seasonally adjusted annual rate of $787.2 billion, 0.2 percent (±1.8%)* above the revised August estimate of $786.0 billion. The September figure is 1.3 percent (±1.9%)* below the September 2010 estimate of $797.3 billion.
 This graph shows private residential and nonresidential construction spending, and public spending, since 1993. Note: nominal dollars, not inflation adjusted.
Private residential spending is 66% below the peak in early 2006, and non-residential spending is 34% below the peak in January 2008.
Public construction spending is now 12% below the peak in March 2009.
• ISM Non-Manufacturing Index indicates expansion in October
 The October ISM Non-manufacturing index was at 52.9%, down slightly from 53.0% in September. The employment index increased in October to 53.3%, up from 48.7% in September. From the Institute for Supply Management: October 2011 Non-Manufacturing ISM Report On Business®
 This graph shows the ISM non-manufacturing index (started in January 2008) and the ISM non-manufacturing employment diffusion index.
This was slightly below the consensus forecast of 53.0% and indicates slightly slower expansion in October than in September. The employment index indicated expansion in October following contraction in September.
• Other Economic Stories ...
• Chicago PMI at 58.4, down from 60.4 in September
• Dallas Fed Manufacturing Survey shows sluggish expansion
• Restaurant Performance Index increased in September
• ADP: Private Employment increased 110,000 in October
• HVS: Q3 Homeownership and Vacancy Rates


