by Calculated Risk on 5/23/2012 11:22:00 AM
Wednesday, May 23, 2012
New Home Sales Comments
Clearly new home sales have bottomed. Although sales are still historically very weak, sales are up 25% from the low, and up about 15% from the May 2010 through September 2011 average.
Update: Some people think housing will recover rapidly to the 1.2+ million rate we saw in 2004 and 2005. I think that is incorrect for two reasons. First, I think the recovery will be sluggish - 2012 will probably be the third worst year ever. Second, the 1.2 million in annual sales was due to an increasing homeownership rate and speculative buying. With a stable homeownerhip rate, and little speculative buying, sales will probably only rise to around 800 thousand at full recovery.
There were more upward revisions this month too. Sales were revised up for January, February and March.
And inventory of completed homes is at a new record low
On inventory, according to the Census Bureau:
"A house is considered for sale when a permit to build has been issued in permit-issuing places or work has begun on the footings or foundation in nonpermit areas and a sales contract has not been signed nor a deposit accepted."Starting in 1973 the Census Bureau broke this down into three categories: Not Started, Under Construction, and Completed.
 Click on graph for larger image.
This graph shows the three categories of inventory starting in 1973.
The inventory of completed homes for sale was at a record low 46,000 units in April. The combined total of completed and under construction is at the lowest level since this series started.
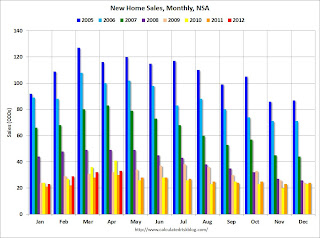
The second graph shows sales NSA (monthly sales, not seasonally adjusted annual rate).
In April 2012 (red column), 33 thousand new homes were sold (NSA). Last year only 30 thousand homes were sold in March. This was the fourth weakest April since this data has been tracked. The high for April was 116 thousand in 2005.
 The debate is now about the strength of the recovery, not whether there is a recovery. My view is housing will remain sluggish for some time, and I expect 2012 to be another historically weak year, but clearly better than 2011.
Below is an update to the "distressing gap" graph that shows existing home sales (left axis) and new home sales (right axis) through April. This graph starts in 1994, but the relationship has been fairly steady back to the '60s.
 Following the housing bubble and bust, the "distressing gap" appeared mostly because of distressed sales. The flood of distressed sales has kept existing home sales elevated, and depressed new home sales since builders haven't been able to compete with the low prices of all the foreclosed properties.
 I expect this gap to eventually close, but it will probably take a number of years.
Note: Existing home sales are counted when transactions are closed, and new home sales are counted when contracts are signed. So the timing of sales is different.


