by Calculated Risk on 6/26/2012 09:00:00 AM
Tuesday, June 26, 2012
Case Shiller: House Prices increased in April
S&P/Case-Shiller released the monthly Home Price Indices for April (a 3 month average of February, March and April).
This release includes prices for 20 individual cities and two composite indices (for 10 cities and 20 cities).
Note: Case-Shiller reports NSA, I use the SA data.
From S&P: Home Prices Rise in April 2012 According to the S&P/Case-Shiller Home Price Indices
Data through April 2012, released today by S&P Indices for its S&P/CaseShiller Home Price Indices ... showed that on average home prices increased 1.3% in the month of April for both the 10- and 20-City Composites. This comes after seven consecutive months of falling home prices as measured by both indices.
April’s data indicate that on an annual basis home prices fell by 2.2% for the 10-City Composite and by 1.9% for the 20-City Composites, versus April 2011. While still negative, this is an improvement over the annual rates of -2.9% and -2.6% recorded for the month of March 2012. Both Composites and 18 of the 20 MSAs saw increases in annual returns in April compared to those published for March; only Detroit and New York fared worse in April ...
...
“With April 2012 data, we finally saw some rising home prices,” says David M. Blitzer, Chairman of the Index Committee at S&P Indices. “On a monthly basis, 19 of the 20 MSAs and both Composites rose in April over March. Detroit was the only city that saw prices fall, down 3.6%. In addition, 18 of the 20 MSAs and both Composites saw better annual rates of return. It has been a long time since we enjoyed such broadbased gains. While one month does not make a trend, particularly during seasonally strong buying months, the combination of rising positive monthly index levels and improving annual returns is a good sign.
 Click on graph for larger image.
 The first graph shows the nominal seasonally adjusted Composite 10 and Composite 20 indices (the Composite 20 was started in January 2000).
The Composite 10 index is off 33.3% from the peak, and up 0.7% in April (SA). The Composite 10 is up from the post bubble low set in March, Not Seasonally Adjusted (NSA).
The Composite 20 index is off 33.0% from the peak, and up 0.7% (SA) in April. The Composite 20 is also up from the post-bubble low set in March (NSA).
 The second graph shows the Year over year change in both indices.
The Composite 10 SA is down 2.2% compared to April 2011.
The Composite 20 SA is down 1.9% compared to April 2011. This was a smaller year-over-year decline for both indexes than in March.
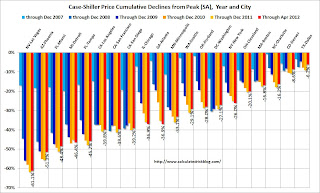
The third graph shows the price declines from the peak for each city included in S&P/Case-Shiller indices.
 Prices increased (SA) in 17 of the 20 Case-Shiller cities in April seasonally adjusted (18 cities increased NSA). Prices in Las Vegas are off 61.1% from the peak, and prices in Dallas only off 6.2% from the peak. Note that the red column (cumulative decline through April 2012) is the lowest for only a couple of cities.
This was better than the consensus forecast, and the NSA indexes are above the post-bubble lows set last month (NSA). I'll have more on prices later.


