by Calculated Risk on 6/16/2012 08:02:00 AM
Saturday, June 16, 2012
Summary for Week ending June 15th
Another week. More disappointment. A broken record ...
The European problems are dominating the headlines, with the Greek election on Sunday, and bond yields increasing in Spain and Italy. In response, the UK has announced a new stimulus plan, and the ECB is hinting at further monetary accommodation.
US data was weak again. Retail sales and industrial production declined, consumer sentiment was down, and initial weekly unemployment claims increased. And the NY Fed manufacturing survey showed slow expansion in June.
However inflation appears to be falling and this increases the possibility of further Fed policy accommodation at the FOMC meeting next week.
The coming week will be about Europe – especially Greece – housing, and the Fed.
Here is a summary of last week in graphs:
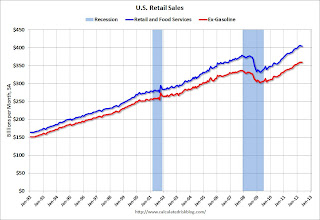
• Retail Sales declined 0.2% in May
 Click on graph for larger image.
On a monthly basis, retail sales were down 0.2% from April to May (seasonally adjusted), and sales were up 5.3% from May 2011. Sales for April was revised down to a 0.2% decrease from a 0.1% increase.
This graph shows retail sales since 1992. This is monthly retail sales and food service, seasonally adjusted (total and ex-gasoline).
Retail sales are up 22.1% from the bottom, and now 6.8% above the pre-recession peak (not inflation adjusted)
This was at the consensus forecast for retail sales of a 0.2% decrease in May, and below the consensus for a 0.1% decrease ex-auto.
• Key Measures show slowing inflation in May
 This graph shows the year-over-year change for four key measures of inflation. On a year-over-year basis, the median CPI rose 2.3%, the trimmed-mean CPI rose 2.1%, and core CPI rose 2.3%. Core PCE is for April and increased 1.9% year-over-year.
 Most of these measures show inflation on a year-over-year basis are still above the Fed's 2% target, but it appears the inflation rate is slowing. On a monthly basis (annualized), most of these measure were below the Fed's target; median CPI was at 1.5%, trimmed-mean CPI was at 1.1%, and Core PCE for April was at 1.6% - although core CPI was at 2.4%.
• Industrial Production, Capacity Utilization declined in May
 "Capacity utilization for total industry declined 0.2 percentage point to 79.0 percent."
This graph shows Capacity Utilization. This series is up 12.2 percentage points from the record low set in June 2009 (the series starts in 1967).
Capacity utilization at 79.0% is still 1.3 percentage points below its average from 1972 to 2010 and below the pre-recession levels of 80.6% in December 2007.
 This graph shows industrial production since 1967.
Industrial production declined 0.1 to in May to 97.3. This is 16.6% above the recession low, but still 3.4% below the pre-recession peak.
The consensus was for no change in Industrial Production in April, and for no change in Capacity Utilization at 79.2%. This was below expectations.
• Consumer Sentiment declines in June to 74.1
 The preliminary Reuters / University of Michigan consumer sentiment index for June declined to 74.1, down from the May reading of 79.3.
This was below the consensus forecast of 77.5 and the lowest level this year.
Overall sentiment is still weak - probably due to a combination of the high unemployment rate and the sluggish economy.
• Weekly Initial Unemployment Claims increased to 386,000
 "In the week ending June 9, the advance figure for seasonally adjusted initial claims was 386,000, an increase of 6,000 from the previous week's revised figure of 380,000."
This graph shows the 4-week moving average of weekly claims since January 2000. The dashed line on the graph is the current 4-week average. The four-week average of weekly unemployment claims increased to 382,000.
The average has been between 363,000 and 384,000 all year, and this is near the high for the year.
• NFIB: Small Business Optimism Index "Stagnates" in May
 This graph shows the small business optimism index since 1986. The index decreased slightly to 94.4 in May from 94.5 in April.
For the second consecutive month, the "single most important problem" was not "poor sales". In the best of times, small business owners complain about taxes and regulations, and that is starting to happen again.
This index remains low, but as housing continues to recover, I expect this index to increase (there is a high concentration of real estate related companies in this index).
• Other Economic Stories ...
• Fed Survey: From 2007 to 2010, Median Family income declined 7.7%, Median Net Worth declined 38.8%
• CoreLogic: Existing Home Shadow Inventory declines 15% year-over-year
• NY Fed: Regional manufacturing activity "expanded slightly" in June Survey


