by Calculated Risk on 8/29/2012 11:00:00 AM
Wednesday, August 29, 2012
Fed: Consumer Deleveraging Continued in Q2
From the NY Fed: Overall Delinquency Rates Down as Americans Paying More Debt on Time
In its latest Quarterly Report on Household Debt and Credit, the Federal Reserve Bank of New York today announced that delinquency rates for mortgages (6.3 percent), credit cards (10.9 percent), and auto loans (4.2 percent) decreased from the previous quarter. However, rates for student loans (8.9 percent) and home equity lines of credit (HELOC) (4.9 percent) increased from March.Here is the Q2 report: Quarterly Report on Household Debt and Credit
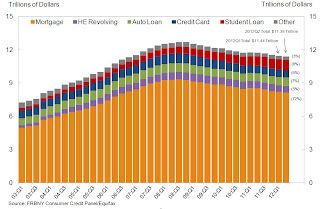
Household indebtedness declined to $11.38 trillion, a $53 billion decline from the first quarter of 2012. Outstanding household debt has decreased $1.3 trillion since its peak in Q3 2008. The reduction was led by a decline in real estate-related debt like mortgages and HELOC. More information about how Americans are paying down their debt is available in our corresponding blog post.
"The continuing decrease in delinquency rates suggests that consumers are managing their debts better," said Wilbert van Der Klaauw, vice president and economist at the New York Fed. "As they continue to pay down debt and take advantage of low interest rates, Americans are moving forward with rebalancing their household finances."
... Mortgage originations, which we measure as the appearance of new mortgages on consumer credit reports, rose to $463 billion.
Mortgage balances shown on consumer credit reports continued to fall, and now stand at $8.15 trillion, a 0.5% decrease from the level in 2012Q1. Home equity lines of credit (HELOC) balances dropped by $23 billion (3.7%). Household debt balances excluding mortgages and HELOCS increased by 0.4% in the second quarter to $2.6 trillion, boosted by increases of $14 billion in auto loans and $10 billion in student loans.Here are two graphs:
...
About 256,000 individuals had a new foreclosure notation added to their credit reports between March 31 and June 30, a slowdown of 12% since the first quarter and the lowest number seen since mid-2007. ... Foreclosures are down 55% from its peak in Q2 of 2009, which coincided with the bottom of the recession.
 Click on graph for larger image.
The first graph shows aggregate consumer debt decreased in Q2. This was mostly due to a decline in mortgage debt.
However student debt is still increasing. From the NY Fed:
Student loan debt rose $10 billion to $914 billion. ... Since the peak in household debt in 2008Q3, student loan debt has increased by $303 billion, while other forms of debt fell a combined $1.6 trillion.
 The second graph shows the percent of debt in delinquency. In general, the percent of delinquent debt is declining, but what really stands out is the percent of debt 90+ days delinquent (Yellow, orange and red).
 From the NY Fed:
Overall delinquencies improved in 2012Q2. As of June 30, 9.0% of outstanding debt was in some stage of delinquency, compared with 9.3% at the end of 2012Q1. About $1.02 trillion of debt is delinquent, with $765 billion seriously delinquent (at least 90 days late or “severely derogatory”).There are a number of credit graphs at the NY Fed site.


