by Calculated Risk on 8/23/2012 12:59:00 PM
Thursday, August 23, 2012
New Home Sales and Distressing Gap
As I mentioned earlier, new home sales have averaged 360,000 on an annual rate basis through July. That means sales are on pace to increase 18% from last year (I expect some upward revisions, and for sales to increase 20%+ this year).
Here is a table showing sales and the change from the previous year since the peak in 2005:
| Year | New Home Sales (000s) | Change |
|---|---|---|
| 2005 | 1,283 | |
| 2006 | 1,051 | -18% |
| 2007 | 776 | -26% |
| 2008 | 485 | -38% |
| 2009 | 375 | -23% |
| 2010 | 323 | -14% |
| 2011 | 306 | -5% |
| 20121 | 360 | 18% |
| 12012 pace through July. | ||
This is still a very low level of sales, but clearly new home sales have bottomed and are starting to recover. I don't expect sales to increase to 2005 levels, but something close to 800,000 is possible once the number of distressed sales declines to more normal levels.
Here is an update to the distressing gap graph.
 Click on graph for larger image.
This "distressing gap" graph that shows existing home sales (left axis) and new home sales (right axis) through June. This graph starts in 1994, but the relationship has been fairly steady back to the '60s.
Following the housing bubble and bust, the "distressing gap" appeared mostly because of distressed sales. The flood of distressed sales has kept existing home sales elevated, and depressed new home sales since builders haven't been able to compete with the low prices of all the foreclosed properties.
I don't expect much of an increase in existing home sales (distressed sales will slowly decline and be offset by more conventional sales). But I do expect this gap to close - mostly from an increase in new home sales.
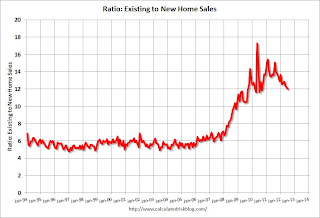
 Another way to look at the same data is as a ratio of existing to new home sales. Historically this ratio has been around 6 (six times as many existing homes sold as new homes sold). I expect this ratio to tend back towards six over the next several years.
Note: Existing home sales are counted when transactions are closed, and new home sales are counted when contracts are signed. So the timing of sales is different.
Earlier:
• New Home Sales increase in July to 372,000 Annual Rate
• New Home Sales graphs


