by Calculated Risk on 8/26/2012 10:18:00 AM
Sunday, August 26, 2012
Zillow: House Prices increased 1.2% Year-over-year in July
Notes: Every month Zillow uses their data to estimate the Case-Shiller index. On Friday I posted their estimate for the June Case-Shiller Composite 20 index showing a 0.3% year-over-year increase.
Of course Zillow has their own house price index that excludes foreclosure resales and they released their report for July last week and I rarely mention it - so here is their most recent release.
From Zillow: U.S. Home Values Climb for Eighth Consecutive Month; Over 60% of Metros Show Increasing Values
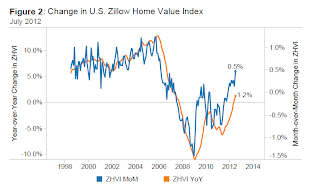
Zillow’s July Real Estate Market Reports ... show that home values increased 0.5 percent to $151,600 from June to July (Figure 1), marking another month of healthy monthly appreciation. Compared to July 2011, home values are up by 1.2 percent (Figure 2), supported in many places by low for-sale inventory. Inventory shortages are being fueled by negative equity and a slowed distribution of REOs. ... On an annual basis, rents across the nation are up by 5.4 percent
 Click on graph for larger image.
 This graph from Zillow shows the national Zillow HPI.
The index was up 0.5% in July, and is up 1.2% over the last year.
The index is off 21.7% from the peak in April 2007. (This excludes foreclosures).
From Zillow:
The Zillow Real Estate Market Reports cover 167 metropolitan areas (metros) of which 102 showed monthly home value appreciation. Among the top 30 metros, 21 experienced monthly home value appreciation and 14 saw annual increases. The largest monthly decline among the top 30 metros took place in St. Louis, where home values fell by 0.4 percent from June to July. Leading the pack on the appreciation side are Phoenix, San Jose and San Francisco, which experienced 2.2, 1.2 and 1.2 percent home value appreciation, respectively
 The second graph is also from Zillow. The year-over-year comparison has turned positive this year, and is positive for the first time since the housing bubble burst.
Zillow also has data on rents and the rate of foreclosed homes.
Note: At the peak of the bubble, we only had the OFHEO HPI (now FHFA and for GSE loans only), and some median price indexes that are impacted by the mix. Now we have a number of house price indexes released every month: Case-Shiller, CoreLogic, LPS, Zillow, FNC and several others.


