by Calculated Risk on 10/03/2012 01:32:00 PM
Wednesday, October 03, 2012
LPS: Mortgage prepayment rates highest since 2005
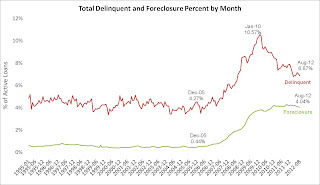
LPS released their Mortgage Monitor report for August today. According to LPS, 6.87% of mortgages were delinquent in August, down from 7.03% in July, and down from 7.68%% in August 2011.
LPS reports that 4.04% of mortgages were in the foreclosure process, down slightly from 4.08% in July, and down from 4.12% in August 2011.
This gives a total of 10.91% delinquent or in foreclosure. It breaks down as:
• 1,910,000 properties that are 30 or more days, and less than 90 days past due, but not in foreclosure.
• 1,520,000 properties that are 90 or more days delinquent, but not in foreclosure.
• 2,020,000 loans in foreclosure process.
For a total of 5,450,000 loans delinquent or in foreclosure in August. This is down from 5,562,000 last month, and down from 6,080,000 in August 2011.
This following graph shows the total delinquent and in-foreclosure rates since 1995.
 Click on graph for larger image.
The total delinquency rate has fallen to 6.87% from the peak in July 2010 of 10.57%. A normal rate is probably in the 4% to 5% range, so there is a long ways to go.
The in-foreclosure rate was at 4.04%. There are still a large number of loans in this category (about 2 million), but it appears this is starting to decline.
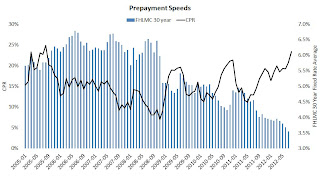
 The second graph shows prepayment speeds vs. mortgage rates. CPR is conditional prepayment rate, a ratio of prepayments to outstandings.
From LPS:
[P]repayment rates in August rose above those seen in the “mini refinance waves” of both 2009 and 2010, hitting their highest levels since 2005. LPS Applied Analytics Senior Vice President Herb Blecher explains that the impact of this increase has been both pronounced and broad-based.
“Our analysis showed an increase in prepayment activity across the entire combined loan-to-value (CLTV) continuum,” Blecher said. “While those loans with equity, particularly 80 percent CLTV and below, have much higher prepayment speeds, the impact of the Obama Administration’s Home Affordable Refinance Program (HARP) was also clear. Loans with a CLTV of more than 120 percent saw the greatest uptick – a 65 percent increase for the year to date. However, it is also becoming evident that loans originated in 2007 and earlier have diminished prospects for conventional refinancing opportunities. Fewer than 30 percent of these vintages remain both active and current, and on average, they are marked by larger negative equity positions and lower credit scores. That said, HARP might yet represent a viable refi option for a good portion of this pool.”


