by Calculated Risk on 11/19/2012 11:12:00 AM
Monday, November 19, 2012
NAHB Builder Confidence increases in November, Highest since May 2006
I'll have some more comments on the Existing Home Sales report later this morning, but this is important too ...
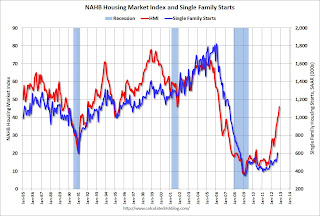
The National Association of Home Builders (NAHB) reported the housing market index (HMI) increased 5 points in November to 46. Any number under 50 indicates that more builders view sales conditions as poor than good.
From the NAHB: Builder Confidence Rises Five Points in November
Builder confidence in the market for newly built, single-family homes posted a solid, five-point gain to 46 on the National Association of Home Builders/Wells Fargo Housing Market Index (HMI) for November, released today. This marks the seventh consecutive monthly gain in the confidence gauge and brings it to its highest point since May of 2006.
“While our confidence gauge has yet to breach the 50 mark -- at which point an equal number of builders view sales conditions as good versus poor -- we have certainly made substantial progress since this time last year, when the HMI stood at 19,” observed NAHB Chief Economist David Crowe. “At this point, difficult appraisals and tight lending conditions for builders and buyers remain limiting factors for the burgeoning housing recovery, along with shortages of buildable lots that have begun popping up in certain markets.”
...
Two out of three of the HMI’s component indexes registered gains in November. The component gauging current sales conditions posted the biggest increase, with an eight-point gain to 49 – its highest mark in more than six years. Meanwhile, the component measuring sales expectations for the next six months held above 50 for a third consecutive month with a two-point gain to 53, and the component measuring traffic of prospective buyers held unchanged at 35 following a five-point gain in the previous month.
All four regions of the country posted gains in their HMI three-month moving averages as of November. The South posted a four-point gain to 43, while the Midwest and West each posted three-point gains, to 45 and 47, respectively, and the Northeast posted a two-point gain to 31. (Note, the HMI survey was conducted in the two weeks immediately following Hurricane Sandy and therefore does reflect builder sentiment during that period.)
 Click on graph for larger image.
This graph compares the NAHB HMI (left scale) with single family housing starts (right scale). This includes the November release for the HMI and the September data for starts (October housing starts will be released tomorrow). This was above the consensus estimate of a reading of 41.


