The U.S. Census Bureau announced today that advance estimates of U.S. retail and food services sales for October, adjusted for seasonal variation and holiday and trading-day differences, but not for price changes, were $411.6 billion, a decrease of 0.3 percent from the previous month, but 3.8 percent above October 2011. ... The August to September 2012 percent change was revised from 1.1 percent to 1.3 percent.
 Click on graph for larger image.
Sales for September were revised up to a 1.3% increase (from 1.1% increase).
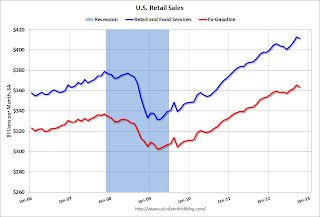
This graph shows retail sales since 1992. This is monthly retail sales and food service, seasonally adjusted (total and ex-gasoline).
Retail sales are up 24.2% from the bottom, and now 8.6% above the pre-recession peak (not inflation adjusted)
 The second graph shows the same data, but just since 2006 (to show the recent changes). Most of the decline in October was due to fewer auto sales - a direct impact of Hurricane Sandy. Retail sales ex-autos were unchanged in October.
Excluding gasoline, retail sales are up 20.2% from the bottom, and now 8.0% above the pre-recession peak (not inflation adjusted).
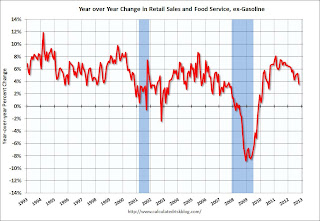
The third graph shows the year-over-year change in retail sales and food service (ex-gasoline) since 1993.
Retail sales ex-gasoline increased by 3.5% on a YoY basis (3.8% for all retail sales).
 This was below the consensus forecast for retail sales of a 0.2% declined in October. However the increase in September was revised up, and most of this decline was related to Hurricane Sandy (there should be some bounce back soon).