by Calculated Risk on 1/07/2013 06:57:00 PM
Monday, January 07, 2013
Housing: Inventory down 24% year-over-year in early January
Inventory declines every year in December and January as potential sellers take their homes off the market for the holidays. That is why it helps to look at the year-over-year change in inventory.
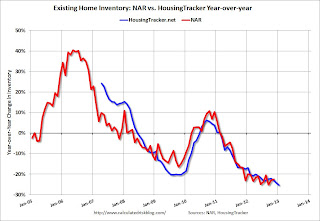
According to the deptofnumbers.com for (54 metro areas), overall inventory is down 23.9% year-over-year in early January, and probably at the lowest level since the early '00s.
This graph shows the NAR estimate of existing home inventory through November (left axis) and the HousingTracker data for the 54 metro areas through early January.
 Click on graph for larger image.
Since the NAR released their revisions for sales and inventory in 2011, the NAR and HousingTracker inventory numbers have tracked pretty well.
On a seasonal basis, housing inventory usually bottoms during the holidays and then starts increasing in February - and peaks in mid-summer. So inventory is probably near the seasonal bottom right now and should start increasing again soon.
The second graph shows the year-over-year change in inventory for both the NAR and HousingTracker.
 HousingTracker reported that the early January listings, for the 54 metro areas, declined 23.9% from the same period last year.
The year-over-year declines will probably start to get smaller since inventory is already very low. It seems very unlikely we will see 20%+ year-over-year declines this summer, and I think overall inventory might be bottoming right now.


