This release includes prices for 20 individual cities, two composite indices (for 10 cities and 20 cities), and the quarterly National Index.
Note: Case-Shiller reports Not Seasonally Adjusted (NSA), I use the SA data for the graphs.
From S&P: Home Prices Closed Out a Strong 2012 According to the S&P/Case-Shiller Home Price Indices
Data through December 2012, released today by S&P Dow Jones Indices for its S&P/Case-Shiller1 Home Price Indices, the leading measure of U.S. home prices, showed that all three headline composites ended the year with strong gains. The national composite posted an increase of 7.3% for 2012. The 10- and 20-City Composites reported annual returns of 5.9% and 6.8% in 2012. Month-over-month, both the 10- and 20-City Composites moved into positive territory with gains of 0.2%; more than reversing last month’s losses.
In addition to the three composites, nineteen of the 20 MSAs posted positive year-over-year growth – only New York fell.
“Home prices ended 2012 with solid gains,” says David M. Blitzer, Chairman of the Index Committee at S&P Dow Jones Indices. “Housing and residential construction led the economy in the 2012 fourth quarter. In December’s report all three headline composites and 19 of the 20 cities gained over their levels of a year ago. Month-over-month, 9 cities and both Composites posted positive monthly gains. Seasonally adjusted, there were no monthly declines across all 20 cities.
...
“Atlanta and Detroit posted their biggest year-over-year increases of 9.9% and 13.6% since the start of their indices in January 1991. Dallas, Denver, and Minneapolis recorded their largest annual increases since 2001. Phoenix continued its climb, posting an impressive year-over-year return of 23.0%; it posted eight consecutive months of double-digit annual growth.”
 Click on graph for larger image.
 The first graph shows the nominal seasonally adjusted Composite 10 and Composite 20 indices (the Composite 20 was started in January 2000).
The Composite 10 index is off 30.0% from the peak, and up 0.9% in December (SA). The Composite 10 is up 6.2% from the post bubble low set in March (SA).
The Composite 20 index is off 29.2% from the peak, and up 0.9% (SA) in December. The Composite 20 is up 7.0% from the post-bubble low set in March (SA).
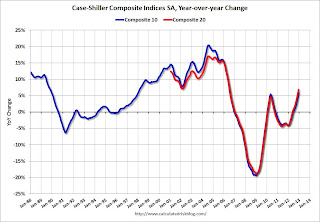
 The second graph shows the Year over year change in both indices.
The Composite 10 SA is up 5.9% compared to December 2011.
The Composite 20 SA is up 6.8% compared to December 2011. This was the seventh consecutive month with a year-over-year gain since 2010 (when the tax credit boosted prices temporarily). This was the largest year-over-year gain for the Composite 20 index since 2006.
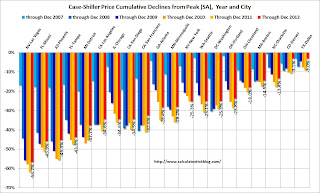
The third graph shows the price declines from the peak for each city included in S&P/Case-Shiller indices.
 Prices increased (SA) in 20 of the 20 Case-Shiller cities in December seasonally adjusted (also 19 of 20 cities increased NSA). Prices in Las Vegas are off 56.7% from the peak, and prices in Dallas only off 3.0% from the peak. Note that the red column (cumulative decline through December 2012) is above previous declines for all cities.
This was at the consensus forecast for a 6.8% YoY increase. I'll have more on prices later.